

Unpacking Malicious DLLs – IcedID
So recently I’ve been reverse engineering the newest version of IcedID (the version hiding encrypted payloads and other data inside PNGs), and I came across a post by Malware-Traffic-Analysis about IcedID being downloaded by malspam typically responsible for downloading ISFB.
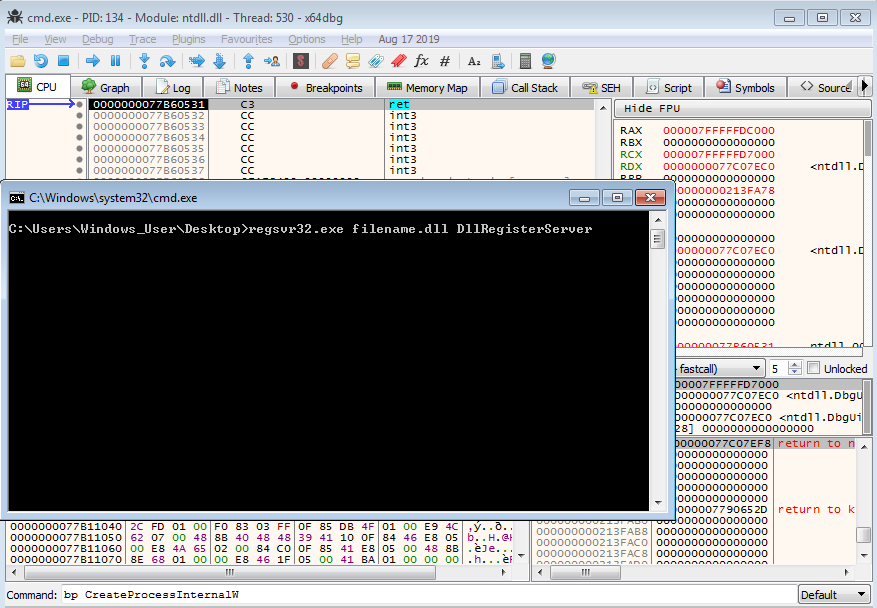
This particular infection chain was interesting, as the Word Document drops a script file to the ProgramData folder, naming it index.html – this script reaches out to a C2 server, and downloads the IcedID loader, and saves it as filename.dll to the ProgramData folder as well. This is then executed using regsvr32.exe, passing the DLL and the export to execute, DllRegisterServer.
Unlike unpacking executables, you can’t just throw a DLL (in most cases) into x64dbg and put a breakpoint on the relevant calls to get the unpacked payload – the main reason for this is the fact that (as far as I am aware) there is currently no option inside x64dbg to select specific exports of the DLL to execute – the debugger will simply start execution from the entry point it finds in the payload, which may or may not be the correct unpacking function.
You could use Ollydbg in this case, as that has a viable export-executor option, but I’m not much of a fan of Ollydbg, so let’s have a look at how we can unpack the DLL using x64dbg and regsvr32.exe!
If you’re interested in following along with the sample, or perhaps any other DLLs you need to unpack (this should work for most of them!) you can grab the sample from VirusBay, or from the Malware-Traffic-Analysis site!
MD5 of packed IcedID Sample: 5a4496dfc1053c0c83ec5bb1b50be37a
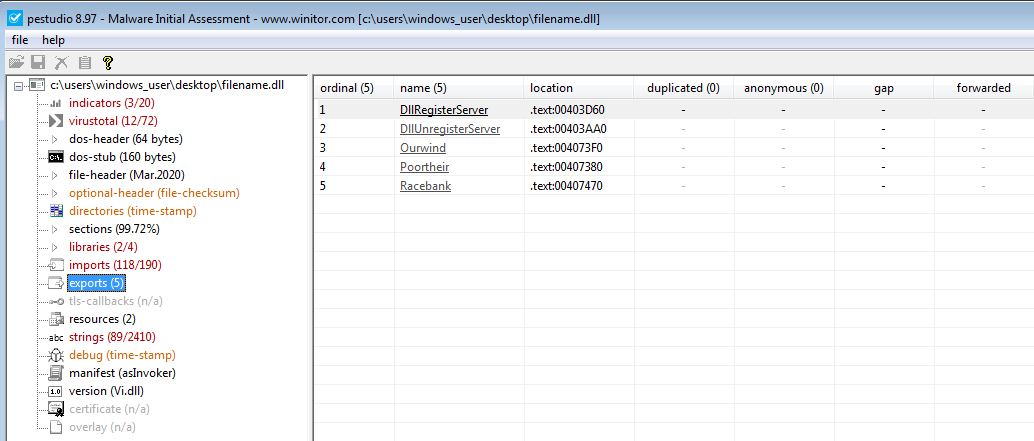
So, first things first, when analyzing a DLL, I check to see what functions it exports. Opening it up in PEStudio, or another PE analyzer, we can see it has a total of 5 exports:
DllRegisterServer
DllUnregisterServer
Ourwind
Poortheir
Racebank
In our case, we know it executes DllRegisterServer, so let’s go ahead and put it into x32dbg, to see if the inbuilt DLLLoader executes any of the exports.
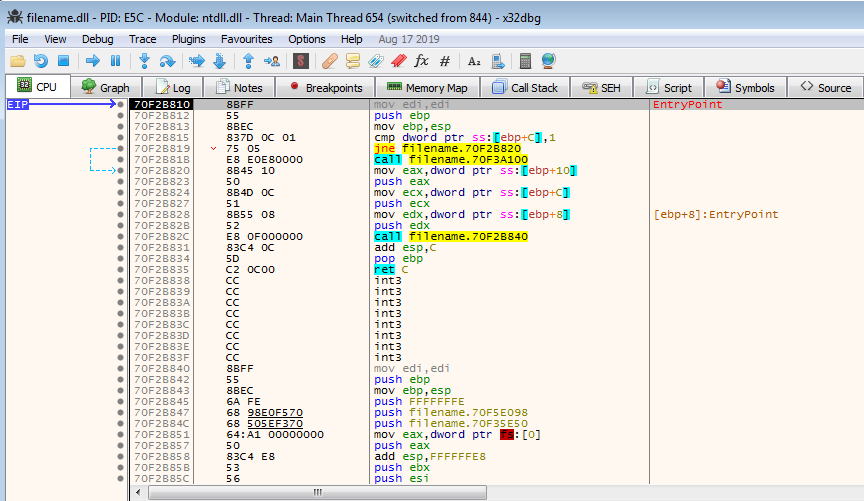
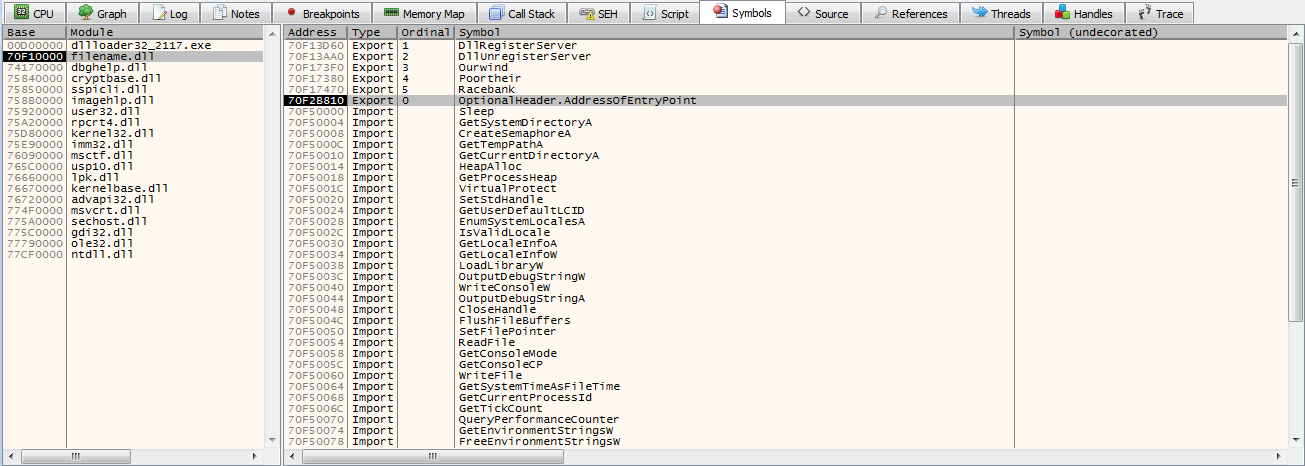
As you can see, the debugger breaks on the DLL entry point, and sure enough, if we check the symbols in the DLL, we can see that the DLLLoader has executed export 0, which is the entry point found in the Optional Header. So, this means we will need to debug through the infection route, so let’s get to it!
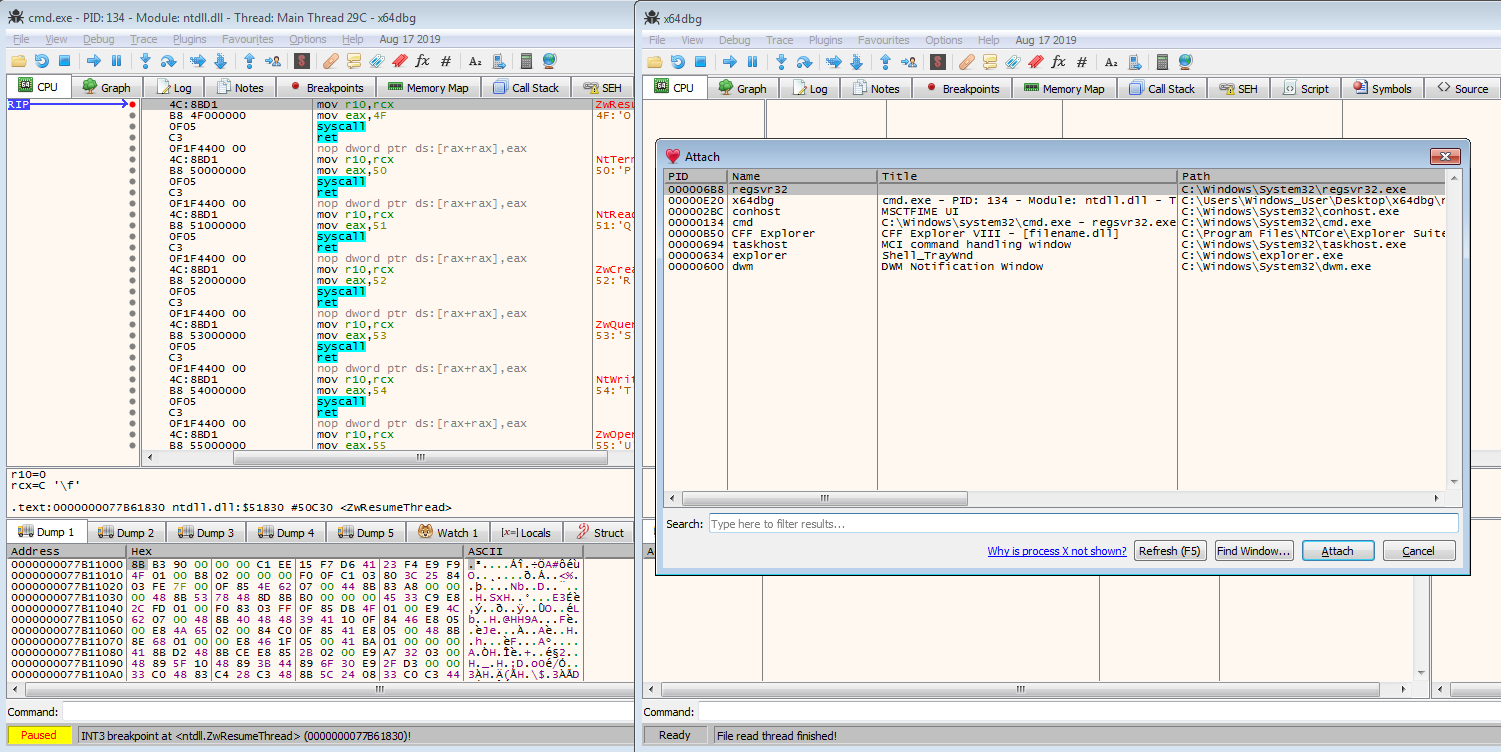
First, we need to open up cmd.exe and enter the regsvr32.exe command to execute. Before hitting enter and executing the command, we need to attach to the cmd.exe process, so that we can control program execution in order to attach to regsvr32.exe before it begins executing our DLL. As I am on a 64 bit VM, I’ll be using x64dbg here. Once we have attached to the process, let’s put a breakpoint on CreateProcessInternalW – the debugger will break on this just before regsvr32.exe is executed.

After running the debugger, and hitting enter in the cmd.exe window, we hit the breakpoint on CreateProcessInternalW. From here, we can put a breakpoint on NtResumeThread, as this will cause the process to break before resuming the main thread of regsvr32.exe, so it will be stuck in a suspended state, allowing us to open a second debugger and attach to it.
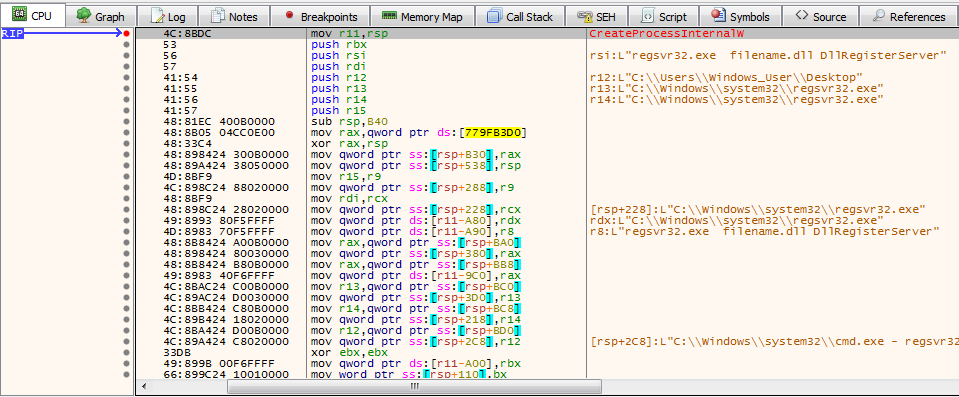
As you may have noticed, in the image above, I am using x64dbg to attach to regsvr32.exe, and not x32dbg – this is important to take note of, as the DLL is 32 bit, and so the 64 bit regsvr32.exe will need to create a 32 bit regsvr32.exe (the process naming can be quite confusing!) in order to execute our malicious DLL. Therefore, we need to put another breakpoint on CreateProcessInternalW in the regsvr32.exe we are attached to.
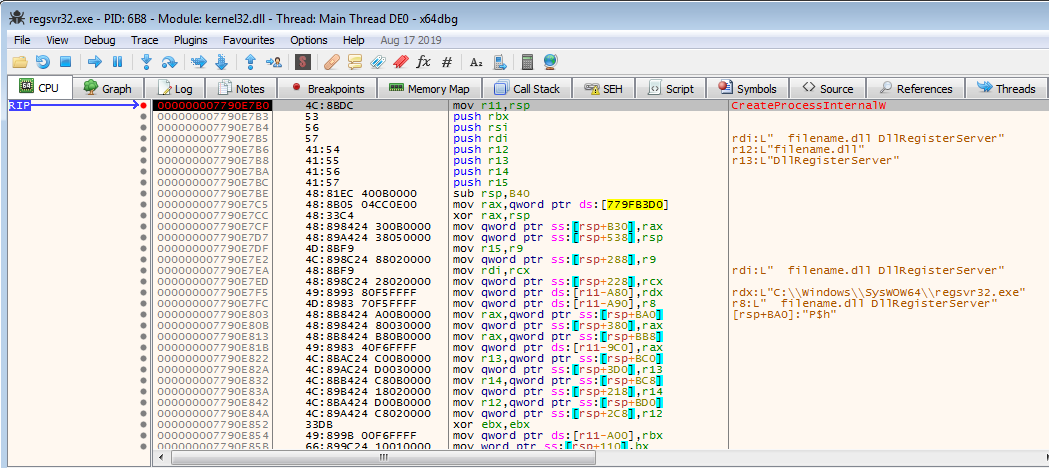
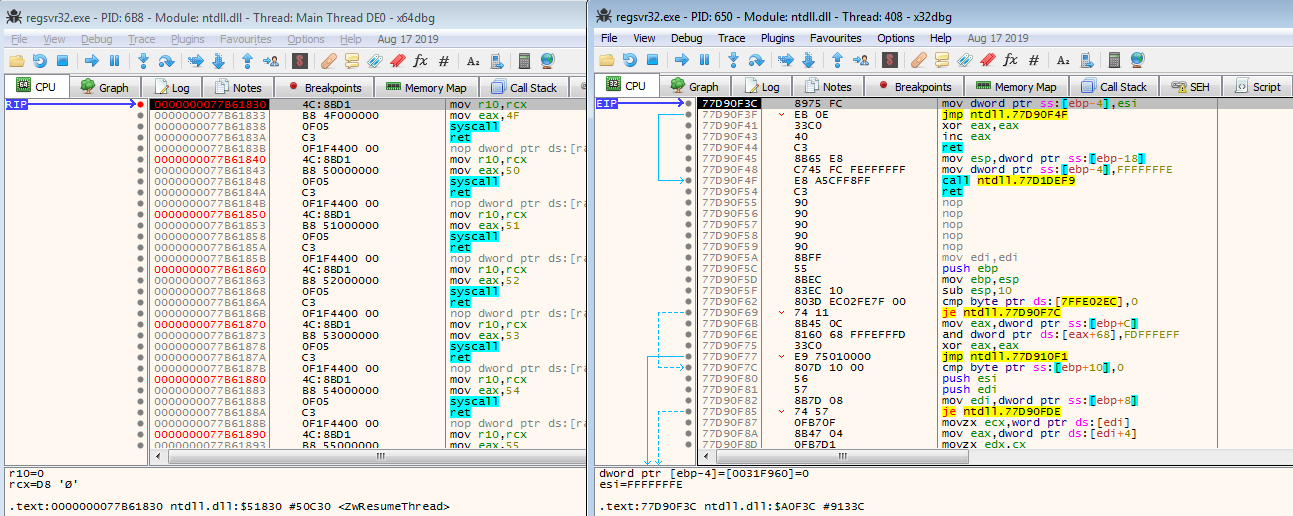
Running the debugger, we hit the breakpoint on CreateProcessInternalW. Put a breakpoint on NtResumeThread, execute the debugger, and then open up x32dbg – you should now be able to attach to the newly created, 32 bit regsvr32.exe process!
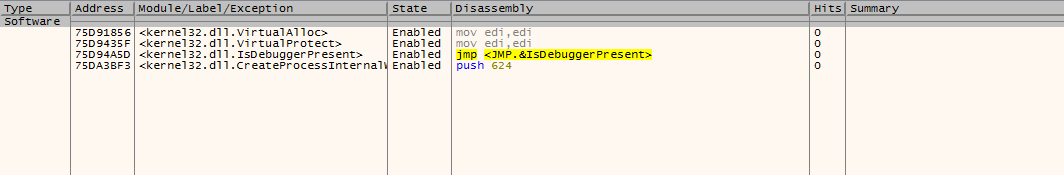
So, now we are attached to the process that will actually call the malicious DLL, let’s put a few breakpoints on some important API calls. I have seen a few IcedID samples before using VB packers, and they commonly use the IsDebuggerPresent API call to determine whether to unpack or not – in this case I don’t believe the sample is using a VB packer, however it may still use this debugger check, so there’s no harm in setting a breakpoint on it. Then we have the common unpacking functions; VirtualAlloc and VirtualProtect, and finally a breakpoint on CreateProcessInternalW, just in case none of our breakpoints trigger and the malware ends up executing.
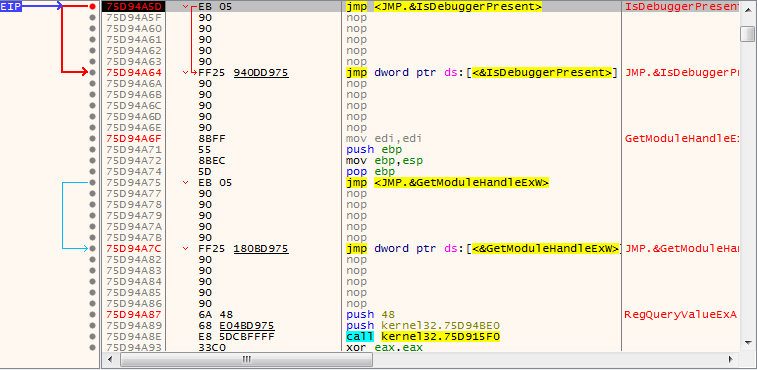
With the breakpoints in place, we can execute the 64 bit regsvr32.exe (the one stuck on NtResumeThread), and then execute the 32 bit regsvr32.exe (the one we just set 4 breakpoints in). After a couple seconds of waiting, the 32 bit process should break on a call to IsDebuggerPresent – if you’ve ever looked at this API or anti-analysis methods in general, you’ll know that if the return value is 1, it indicates to the process that it is being debugged – therefore, we need to alter the return value inside EAX to be 0. After doing so, we can run the debugger once again, and wait until it hits the next breakpoint!
Sure enough, after a few moments, the next API call to be hit is VirtualProtect! This is a good indicator that the code is about to be unpacked, as it is used to change the protection of a region of memory. As a result, we can use the Jump To User Code button in x32dbg, and sure enough, the debugger takes us to the filename.dll code! So, now all we need to do is run the debugger and wait for a new region of memory to be allocated, so we can see if the unpacked payload is stored there.
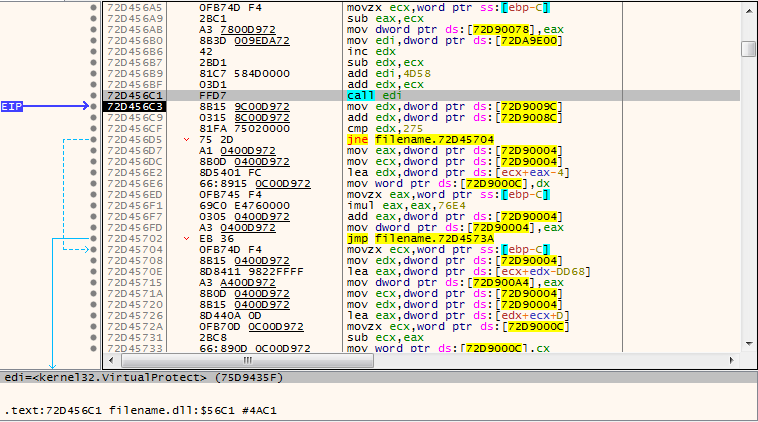
After 2 calls to VirtualAlloc, we get to the third call which is responsible for allocating the region of memory to house our payload. Once the function returns, make sure to follow the address inside EAX in the dump, and then execute the debugger.

The next API call we break on is a call to VirtualProtect – and checking out the dump, you might notice an MZ header in there! At this point, we could dump out the data from memory, and decompress it ourselves – it looks similar to APLib compression, however in many cases it might not be clear what compression/encryption/encoding is used. Luckily, the payload will need to be decompressed before overwriting the initial DLL in memory, and so we should be able to locate it with some searching.
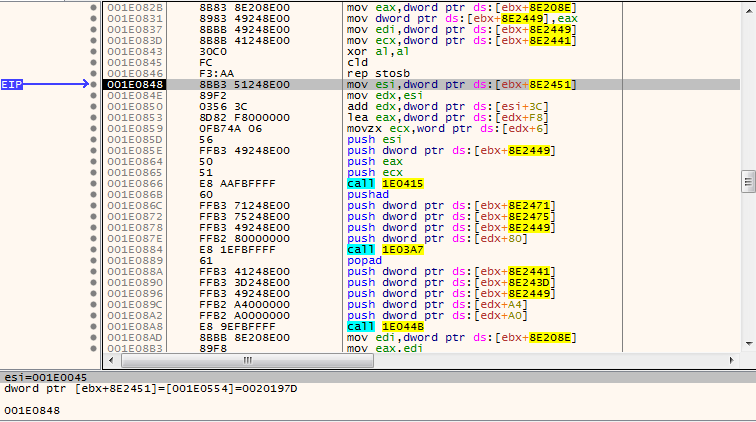
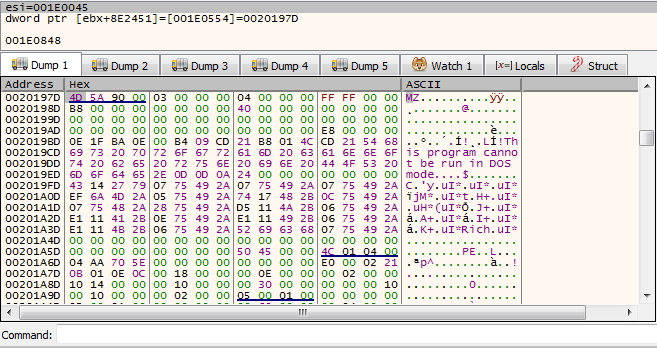
Returning back to user code, and stepping carefully through instructions, I noticed this instruction:
mov esi, dword ptr ds:[ebx+8E2451]
It seems the DWORD being moved into ESI is a pointer to another region of memory, that seems quite out of the way – possibly allocated with a call we weren’t monitoring, such as RtlAllocateHeap.
Viewing the address 0x0020197D in memory, it’s clear that we have located the decompressed executable! This isn’t in it’s own region of memory, so we could dump the whole region and carve it out, or simply select the first byte and scroll down until we reach the end of the payload – in this case there is no data after the end of the payload so it is easy to determine.
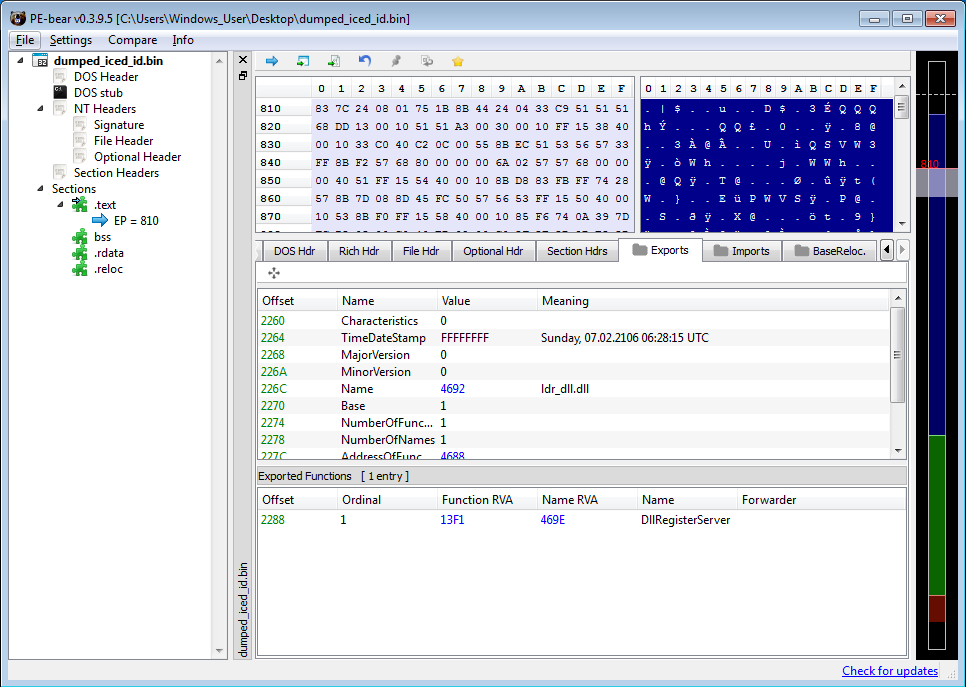
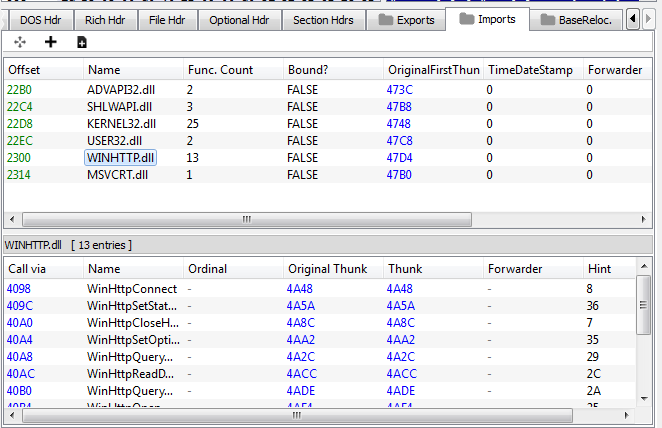
Dumping the payload out and putting it into PEBear, we can see the DLL name is ldr_dll.dll, and checking out the imported API calls we can see some API calls that are commonly used by IcedID loaders, such as functions from the WinHTTP library!
Congratulations! You’ve managed to unpack the malicious DLL, and can now analyze the unpacked payload! I’d recommend keeping the debugger alive, as that will allow you to debug the unpacked payload “naturally”, rather than opening the DLL with DLLLoader in another window, as in certain cases the DLL will utilize memory/values passed to it from the unpacking shellcode – if those values aren’t present, it will terminate immediately. If you’ve got any questions or issues, feel free to reach out via Twitter!
I am currently working on a mini-series on formgrabbers to go on my YouTube channel, which involves reverse engineer a basic formgrabber, developing a basic one in C, developing a basic loader for it, and then finally creating a basic backend C2 in Python to receive gathered data, so stay tuned for that!
Comments (2)
Comments are closed.
Unpacking Malicious DLLs – IcedID
24th March 2020[…] post Unpacking Malicious DLLs – IcedID appeared first on […]
James Haughom
29th March 2020Awesome analysis! Thanks for sharing.
I’ll share a trick I use to execute specific exports when analyzing DLLs. You can open rundll32 in x64dbg, and then change the commandline to invoke the export you want to debug. After doing that you can just have a DLL load BP on the sample, and then can set a BP on the export you want to analyze once it’s loaded in memory. Can also do this with regsvr32 if the DLL has the DllRegisterServer export like this sample 🙂