In this post, I will explain how you can locate cross references programmatically using Python modules that are generally helpful in reverse engineering. As you can see, this will be my first post on 0ffset, and I had gotten the idea to write about this after gaining inspiration from 0verfl0w’s post on using Capstone and Unicorn to resolve stack strings, and discussing about Capstone’s ability to find cross references to functions in a given bit of code – or the lack of it. Based on this, I decided to briefly pause on touching grass and give a demonstration of how this can be done 😎

Once you’ve read through this post, you may also leave with a slightly better general understanding of the PE format, as well as being aware about how opcodes work in Assembly. You are also more than welcome to use, and reference, any part of the code, if you want to use it for building string decryptors, or for similar purposes.
In this post, we will use the following Python modules:
- capstone – this module lives up to its name as the ultimate disassembly engine for binary analysis and is at the heart of several RE tools you see today, such as Unicorn, Qiling and Angr.
- pefile – we will use this module to parse through the sections, headers and their structure members programmatically.
- struct – this module can be used to convert between Python values and C structs/types represented as Python
bytesobjects.
Discovering the PE file’s architecture
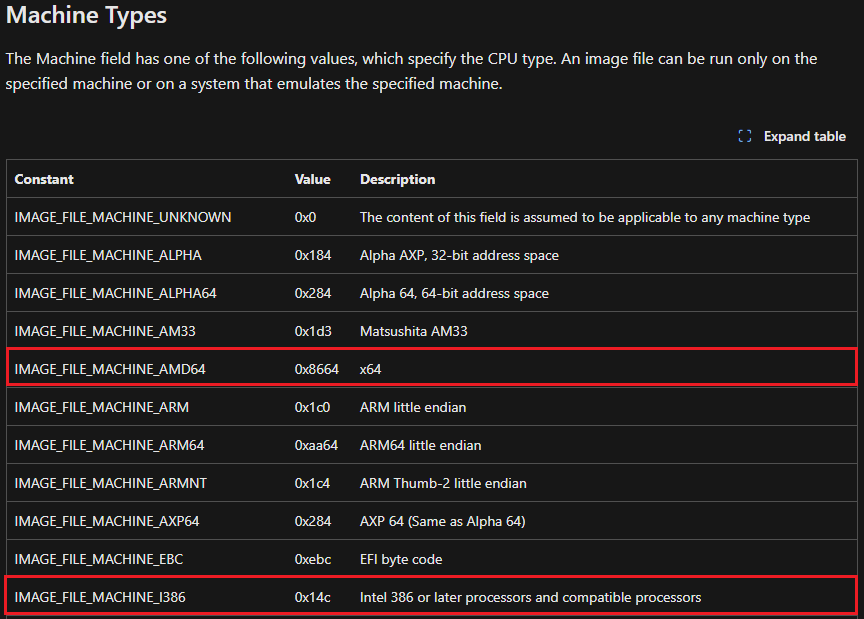
One of the first things the Windows loader does when interpreting the compiled code of a portable executable file is determining its architecture. Microsoft has documentation on locating the machine type of a binary, which specifies the constants IMAGE_FILE_MACHINE_I386 (0x14c) and IMAGE_FILE_MACHINE_AMD64 (0x8664).
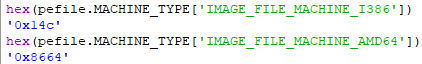
If you also wanted to find this with the pefile module, you can refer to the below:
In our script, we would match on the architecture of the binary with these constants and set up capstone accordingly.
match f.FILE_HEADER.Machine:
    case 0x14c: # IMAGE_FILE_MACHINE_I386
        md = Cs(CS_ARCH_X86, CS_MODE_32)
    case 0x8664: # IMAGE_FILE_MACHINE_AMD64
        md = Cs(CS_ARCH_X86, CS_MODE_64)
Locating Section Characteristics
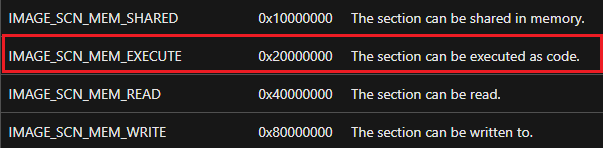
In most cases, a section that contains code to be ran would be marked as executable through its characteristics, using the constant IMAGE_SCN_MEM_EXECUTE (0x20000000).
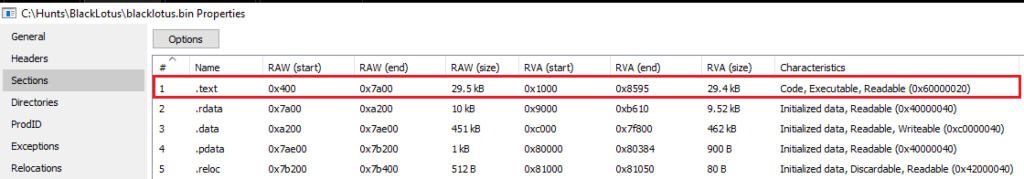
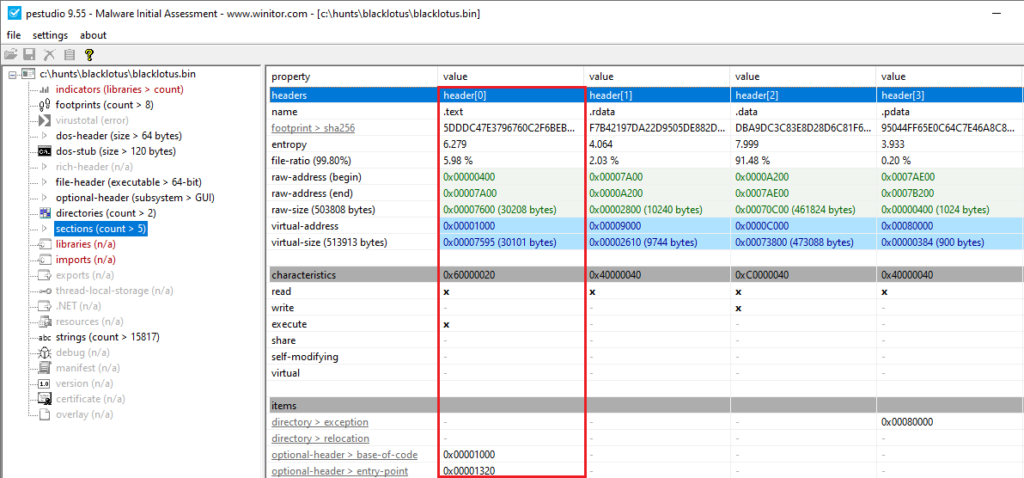
In this example, PE Viewer reveals that the section was to be interpreted as code, and had read and executable (RX) permissions (others tools such as CFF Explorer, Detect It Easy, PE Bear and PE Studio can also be used for this purpose).
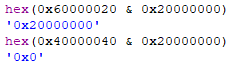
To make the tool functional with other binaries, we can use a bitwise AND operator to focus on sections that contain this flag. If you are not familiar with using bitwise operators in programming languages, in this case it is essentially being used to find out whether the “executable” flag is present, by printing the pair of bits occupying the same position in the two numbers. If not, this results in a return value of 0x0. If you also noticed, not all characteristic values matched to the documentation, as they are summed together and the result would be the total permissions instead. In this instance, we would have the below, which is a sum of 0x00000020, 0x20000000 and 0x40000000 respectively:
IMAGE_SCN_CNT_CODE | IMAGE_SCN_MEM_EXECUTE | IMAGE_SCN_MEM_READTo better understand how bitmasks work, you can check out this article.
Here’s our resulting Python code we’ll use:
if (section.Characteristics & 0x20000000):Locating the Call Mnemonics

According to this documentation, the call mnemonic has multiple opcodes. Depending on the opcode, these can also lead to different immediate types (WORDs, DWORDs etc.) being used as arguments. A key thing to point out is the operand for the call mnemonic we are looking for holds the displacement relative to the next instruction from that address, or in simpler terms, the number of bytes to locate the start of the function code. Once we extract the relative offset of this call, we can then use it to calculate the function address.
To be able to do this, we would also want the correct addresses and sizes to be able to parse data. In PE Studio, we can see the start of the section (namely VirtualAddress, which holds the value of 0x1000) along with its size 0x7600 (30208 bytes), which member name is SizeOfRawData (reference).
Using the below code, we can then locate and print all lines containing the call mnemonic:
for i in md.disasm(section.get_data(), 0, section.SizeOfRawData):
    if i.mnemonic == "call":
        print(i)
Once executed, we would see the below results:
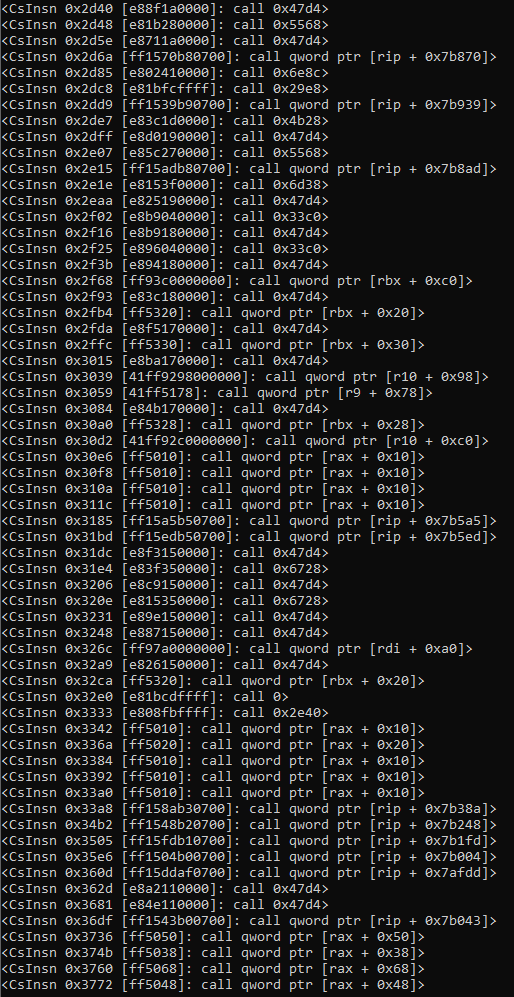
We would want to remove all absolute indirect call lines, as they contain pointers to memory locations which store addresses to Windows API functions. These are later used by the sample once they get resolved in memory. This is not our aim, as we want cross references of functions written by the developer, and keeping the pointers would cause bugs in our code. To prevent this, we can improve this line by ensuring all call mnemonics are specifically using the 0xe8 opcode:
if i.mnemonic == "call" and i.bytes[0] == 0xe8:Another thing to keep note of is that the operands can’t be immediately converted to a Python integer. Just to give a good idea, I’ve tried doing this in the below screenshot:
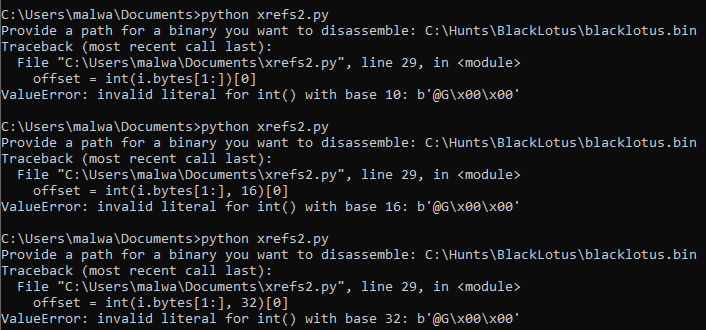
Instead, the struct module can assist with properly converting the argument, using the little-endian and signed integer flags. We decide to use little-endian as the Windows operating system presents data in this format, while network traffic uses big-endian. Signed integers also support both positive and negative numbers, which would be prevalent whenever a line of disassembly makes a call to a function, which is a relative location either before or after it!
offset = struct.unpack("<i", i.bytes[1:])[0]Mapping & Calculating the Function Address
When a binary is mapped into memory, its ImageBase property as well as a section’s virtual address is taken into account, meaning they are summed along with raw offsets in a file. Here would be the equation:
mapped_addr = i.address + f.OPTIONAL_HEADER.ImageBase + section.VirtualAddressWe then calculate the (memory mapped) function addresses by combining its virtual address, along with the offset to find the referenced function and adding 5 more bytes:
func_addr = hex(mapped_addr + offset + 0x5)Finalised Script
As a final step, I’ve added in an area of input which allows one to parse an arbitrary PE file. The script is smart enough to determine the architecture of this file, search for sections which were marked as executable then add lists of cross references for functions into a dictionary.
__description__ = 'Parse a PE binary to locate cross references to functions using Capstone and pefile modules.'
__author__ = 'Malware Guy (@themalwareguy) - https://www.0ffset.net'
__version__ = '1.0.0'
__date__ = '2024/03/04'
from capstone import *
from capstone.x86_const import *
import pefile
import struct
xrefs = {}
f = pefile.PE(input("Provide a path for a binary you want to disassemble: "))
code = f.get_data()
match f.FILE_HEADER.Machine:
case 0x14c: # IMAGE_FILE_MACHINE_I386
md = Cs(CS_ARCH_X86, CS_MODE_32)
case 0x8664: # IMAGE_FILE_MACHINE_AMD64
md = Cs(CS_ARCH_X86, CS_MODE_64)
case _:
raise Exception("Please provide a valid path to a 32-bit or 64-bit PE file.")
offset = 0
for section in f.sections:
if (section.Characteristics & 0x20000000): # IMAGE_SCN_MEM_EXECUTE: 0x20000000
for i in md.disasm(section.get_data(), 0, section.SizeOfRawData):
if i.mnemonic == "call" and i.bytes[0] == 0xe8:
offset = struct.unpack("<i", i.bytes[1:])[0]
mapped_addr = i.address + f.OPTIONAL_HEADER.ImageBase + section.VirtualAddress
func_addr = hex(mapped_addr + offset + 0x5)
if not func_addr in xrefs:
xrefs[func_addr] = list()
xrefs[func_addr].append(hex(mapped_addr))
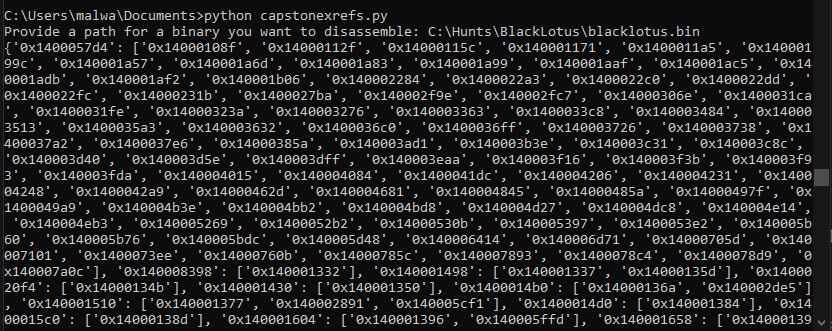
print(xrefs)Here’s what happens after we run the script:
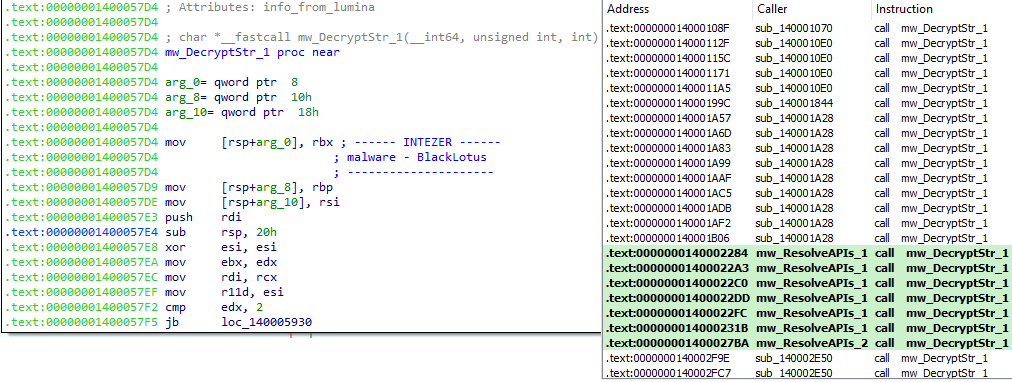
This also matches what we see in a GUI disassembler, taking the address 0x1400057d4 (a string decryption subroutine) as an example:
As you can see, many disassembly, debugging and emulation tools use this method behind the scenes to present machine code to you in a readable format. When having to develop your own tools, having more control behind the scenes can often present a challenge, but is highly rewarding once you have a better idea what you’re doing!

If you hadn’t already, check out 0verfl0w’s post on using the Capstone and Unicorn modules to resolve stack strings! If you also have any questions or thoughts related to this post, feel free to reach out to myself (@themalwareguy) or @0verfl0w_ on Twitter.