I’m finally getting round to writing this post – for the past few months I have been analysing different versions of ISFB/Ursnif/Gozi to gain a deeper understanding in the functionality of this specific malware. In this post, I will be detailing how to unpack and then analyse the first stage loader executable, and then use that information to extract the second stage loader DLL, known as rpcrt4.dll, which we will analyse in a later post.
In a nutshell, ISFB is a banking trojan used to steal financial information from unsuspecting victims. It utilizes several methods to do so, from stealing saved passwords to injecting JavaScript into predetermined websites. This specific sample of ISFB is version 2.14.60, and can be attributed to a specific ISFB v2 group based on the infection routine used – specifically the macros that execute a powershell command that is simply Base64 encoded. The group behind this sample also reuse the encryption key for different campaigns (the default key), making their samples easily identifiable compared to other large groups utilizing ISFB. I have been unable to locate specific threat actor names, and as a result, I will be referring to this group as Group 53, based off of this presentation by FireEye.
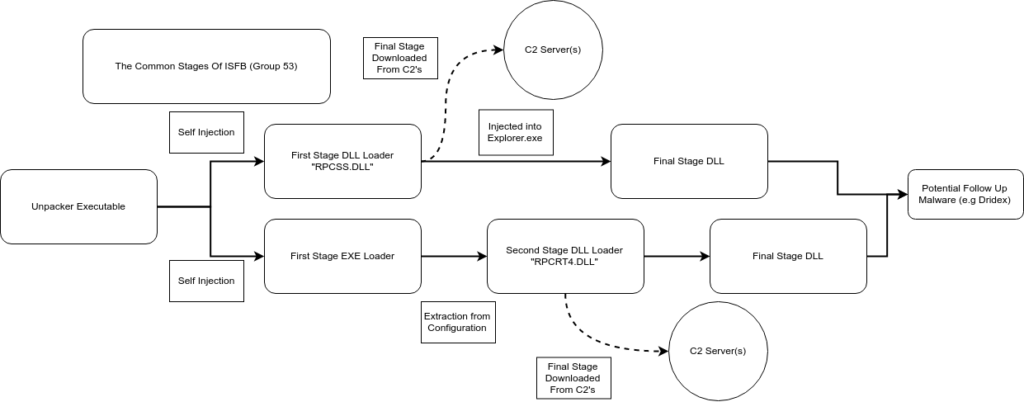
Similarly to other groups utilizing ISFB for financial gain or simply as a stager, Group 53 gains a foothold on the target’s system using a malicious Word document containing embedded macros, which in turn lead to the execution of a Powershell script responsible for downloading the first stage executable. Certain groups “partner” with other groups that are able to distribute malicious spam (malspam) on a large scale, such as the group behind Hancitor. This could potentially result in larger infection numbers, compared to those groups that are relying on their own distribution methods. I would assume “renting” a spot from the group behind Hancitor would be quite expensive as a result of its enormous outreach, which is why a lot of groups, including Group 53, have to distribute their own malicious documents. I will be focusing on the unpacker executable and the first stage executable loader in this post, rather than the Word Document itself, as its functionality is quite straightforward. As always, the samples have been uploaded to VirusBay. So, let’s crack it open!
But, before I do I’d like to thank all of the people who helped me out in analysing the different samples of ISFB, including @VK_Intel, @Nazywam, and @Maciekkotowicz (for his great papers on ISFB). Anyway, let’s get on with the reversing!
Part 1: Unpacking the first stage executable
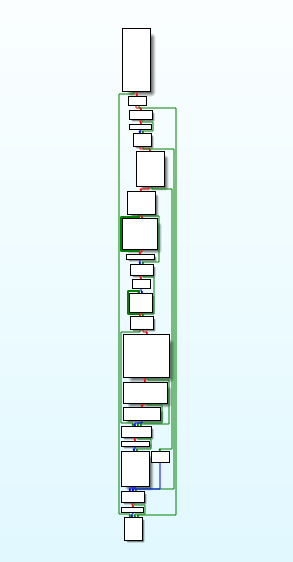
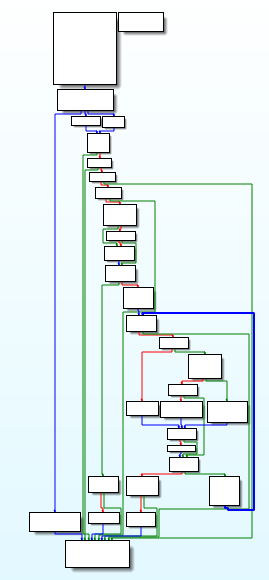
MD5 of First Stage Executable: bc72604061732a9280edbe5e2c1db33bTypically I would open it up in PEStudio or perhaps perform some static analysis, however at this point I have already determined that it is highly likely to be a sample of ISFB, based on the Word Macro, although we still want to unpack the first EXE to be 100% sure that it is in fact ISFB. First, let’s open it in IDA to try and find a call (or jmp) to a memory region or register – this could possibly be a call to the unpacked stage.
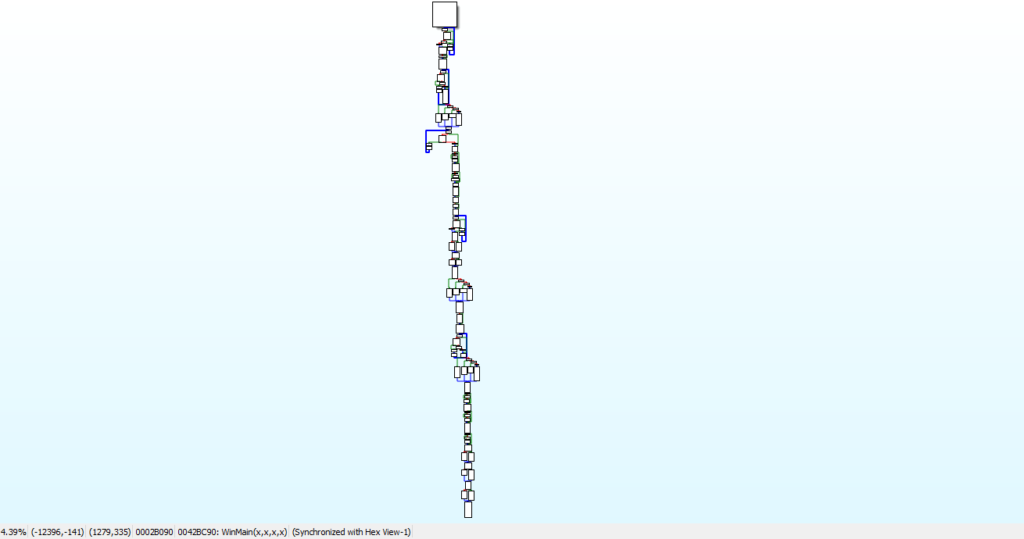
It definitely looks like there is some unpacking going on here (based on the length and intricate flow shown in the image above), and upon looking at the strings in the binary we can see that there aren’t many that are legible, or meaningful. Normally when unpacking a sample, I start at the bottom and work my way up – most unpackers exit once the file has been unpacked – although this depends. In this case, the unpacker performs Self-Injection, and overwrites itself with the unpacked file. This is not unusual for ISFB, and if you analyse some other samples (even from other groups), you will most likely find this occurring too. This means that the unpacker does not exit until the unpacked file does, although we can assume that the last function called will transfer execution over to the unpacked executable.
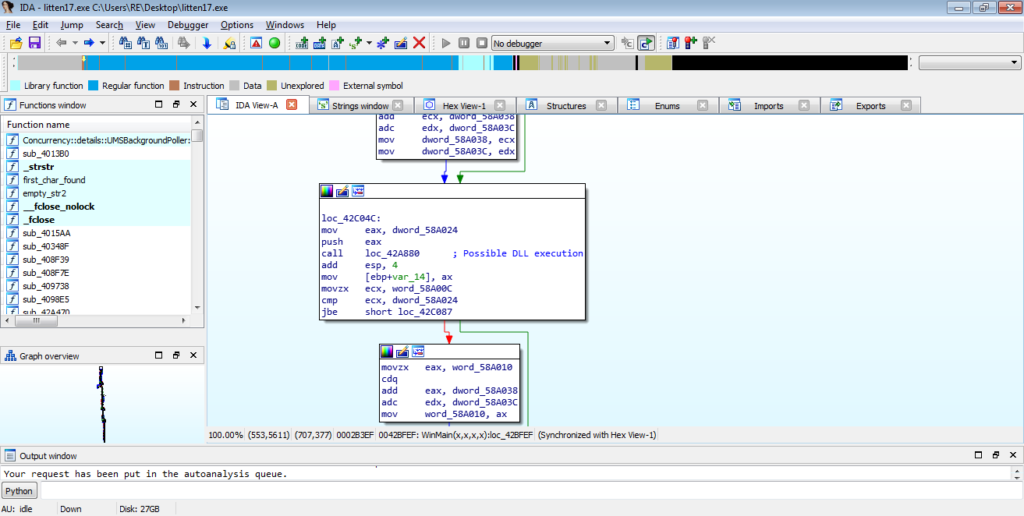
In this specific file, there is no call or jmp to a register or memory region – however, there is a call to loc_42A880. It’s the last call in WinMain, so as mentioned before, this function is most likely responsible for transferring execution over to the EXE.
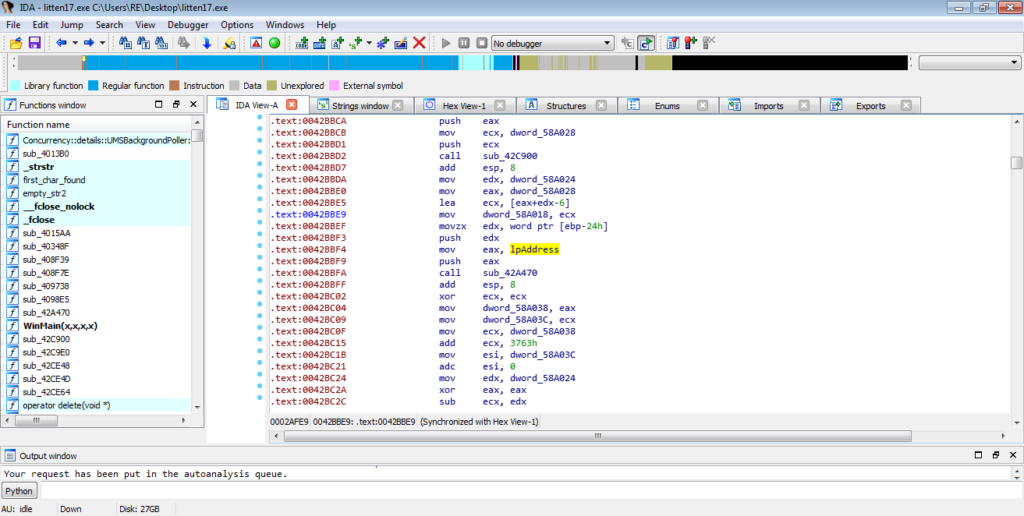
When we jump into this function, it is clear that it hasn’t been converted to a function yet, and so we are unable to view it as a graph. Sometimes, you are able to turn it into a function by pressing “P”, although it doesn’t seem to work in this case. So, we will have to deal with the text mode. It is definitely possible to follow the jumps and conditional jumps to try and find the call or jump to our executable, but we can speed this up a bit. Locate a call instruction and click it – this should highlight the instruction and other instances of it. This doesn’t work for every sample, but it is worth a try to speed things up. Simply scroll down or up from where you are, looking for other instances of call. The last call I located took lpAddress as the first argument, so let’s take a look at this. lpAddress indicates that it contains an address to a region of memory, meaning it could contain the address of our unpacked executable.
Inside this function, if we jump straight to the end, we can see a call to ESI. Hit space to jump from the Graph view back to Text view in order to get the address of this call. This could be the call to our unpacked EXE, and so we need the address of it to view it in x32dbg and put a breakpoint on it.
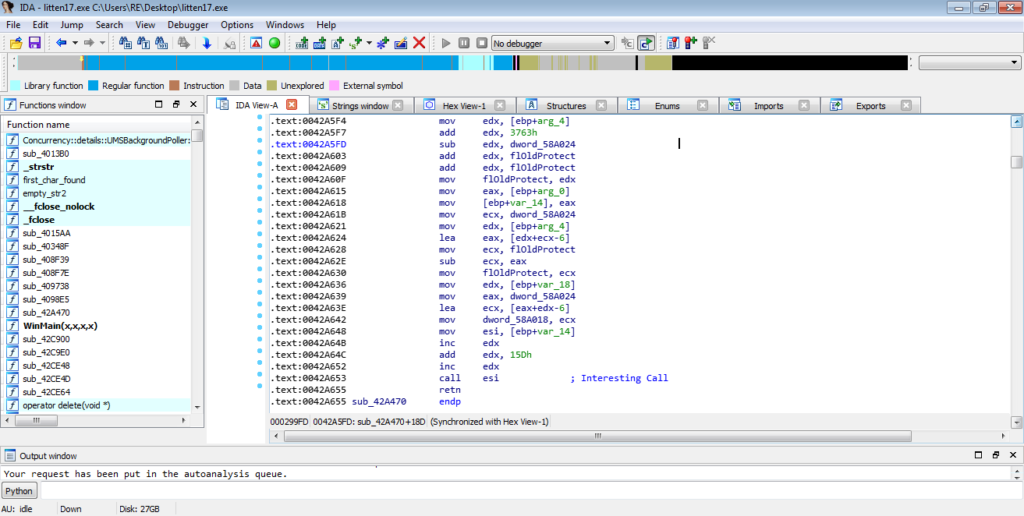
So the memory address to this call is 0x0042A653, so let’s now open this up in x32dbg and jump to this address. Simply push CTRL-G in x32dbg and type in 0042A653, and then hit enter – this will jump to that address, allowing you to put a breakpoint on it. Whilst attempting to unpack a sample, I prefer to open up Process Hacker alongside it, so that if I put a breakpoint on the wrong address and the unpacked process executes, I can easily detect it, either through the Network tab or through the Processes tab.
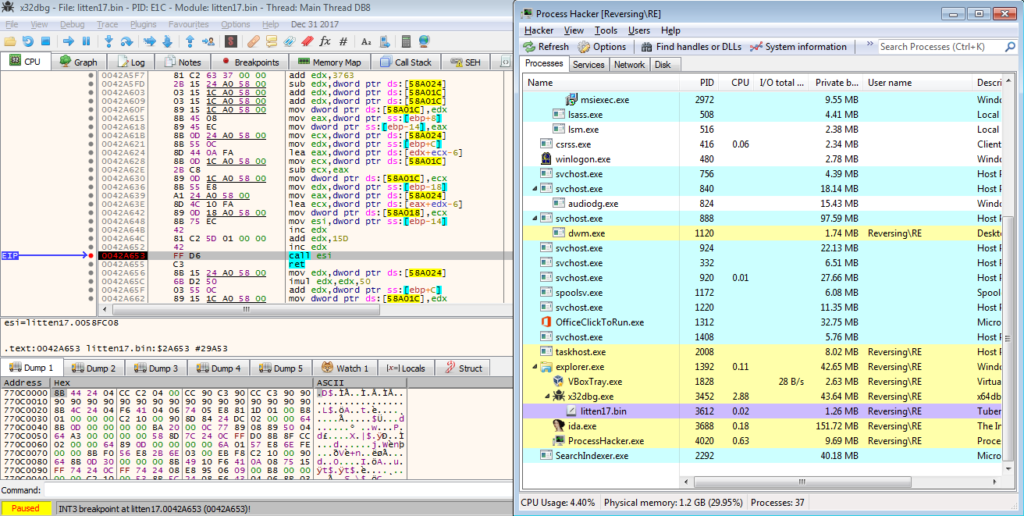
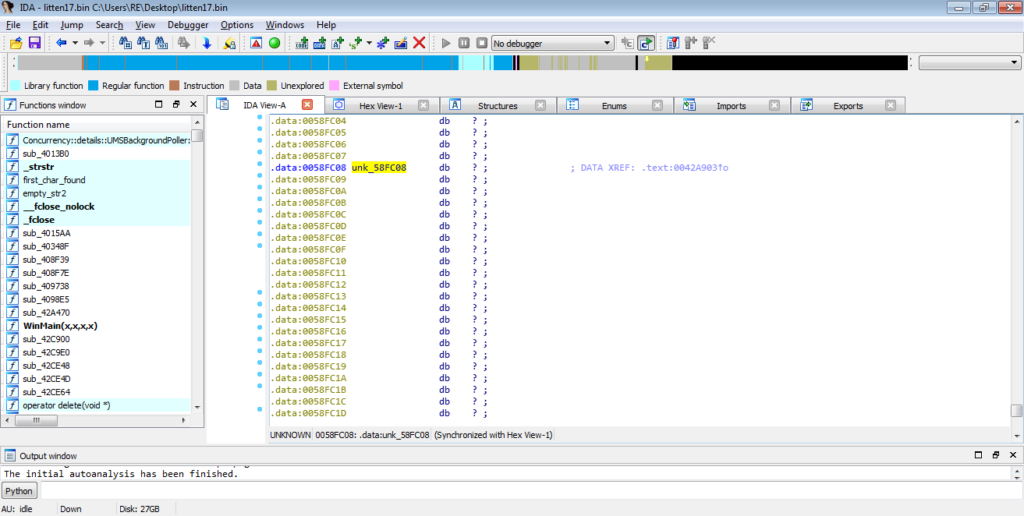
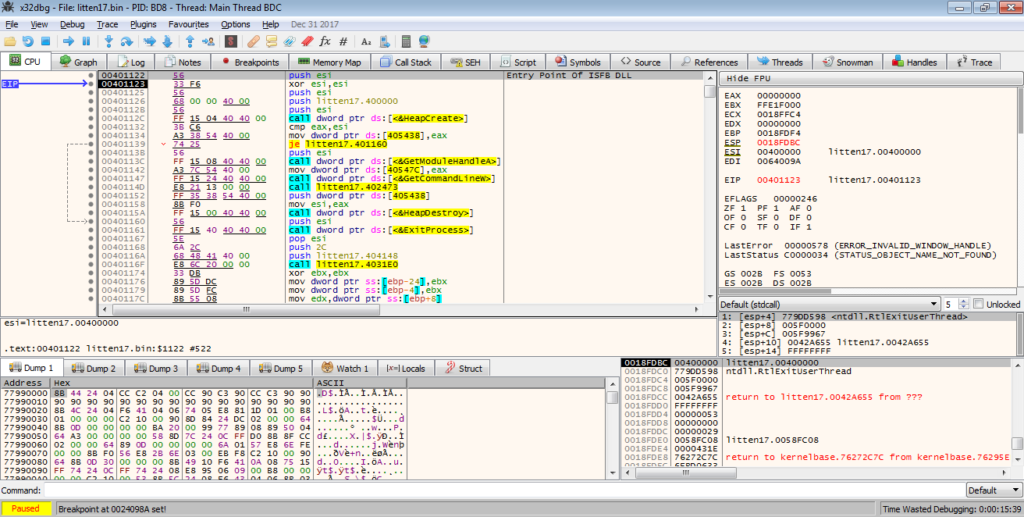
Once the breakpoint has been hit, step into ESI and in this sample there is what seems to be a second unpacking “stage” – this code was not here originally, in fact if we try and view it in IDA, you will simply see a lot of question marks and the variable unk_58FC08.
As it is difficult to statically analyse this section without dumping it and opening it up in IDA, I will be jumping over functions, rather than stepping through them manually. This will also help to speed things up, but make sure your network adapter is not attached, as one of these functions may execute the executable.
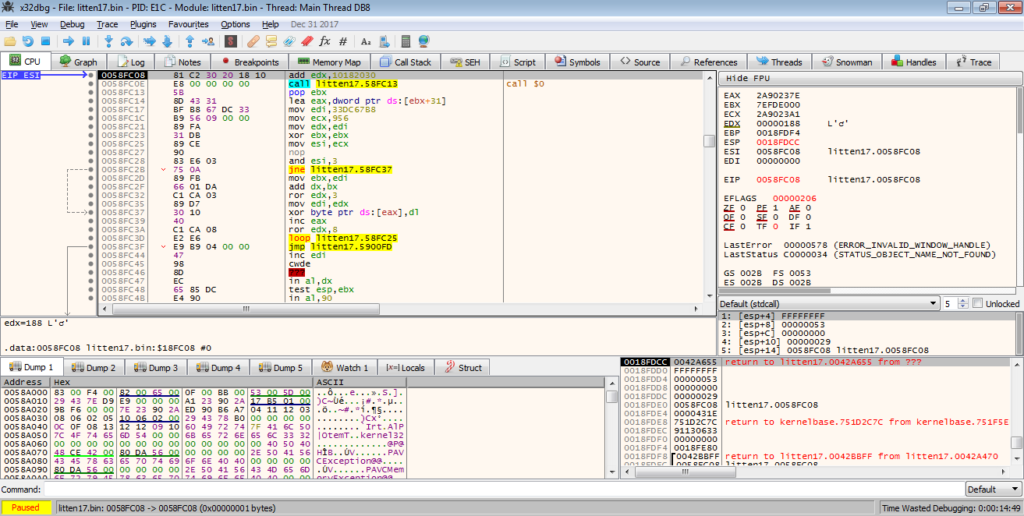
In the GIF below, you can see there is some form of loop going on, with XOR being used to XOR a byte at the memory address stored in EAX, with the value in DL. You might also notice that the assembly is changing as each loop goes on – this is another example of the second unpacking stage. We can simply put a breakpoint on the jmp and then run the program until it hits it.
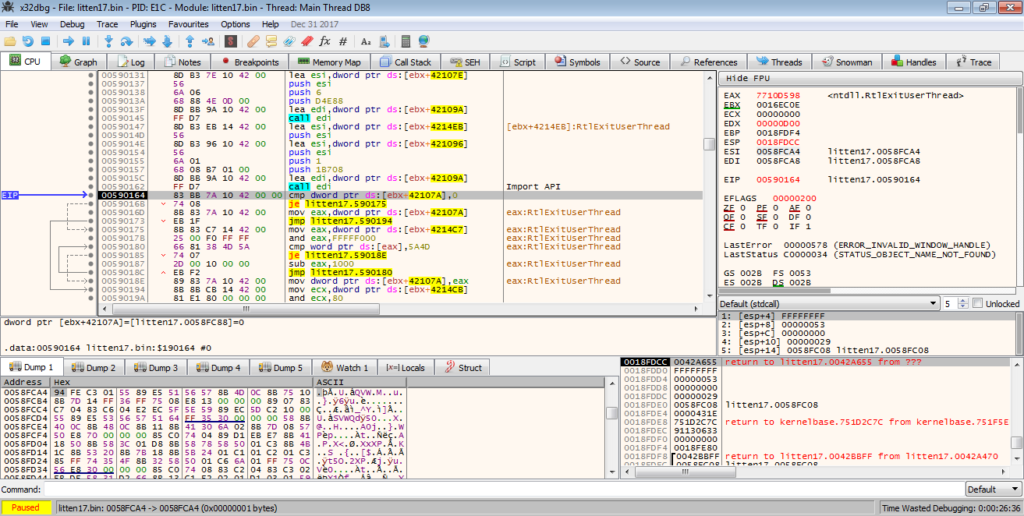
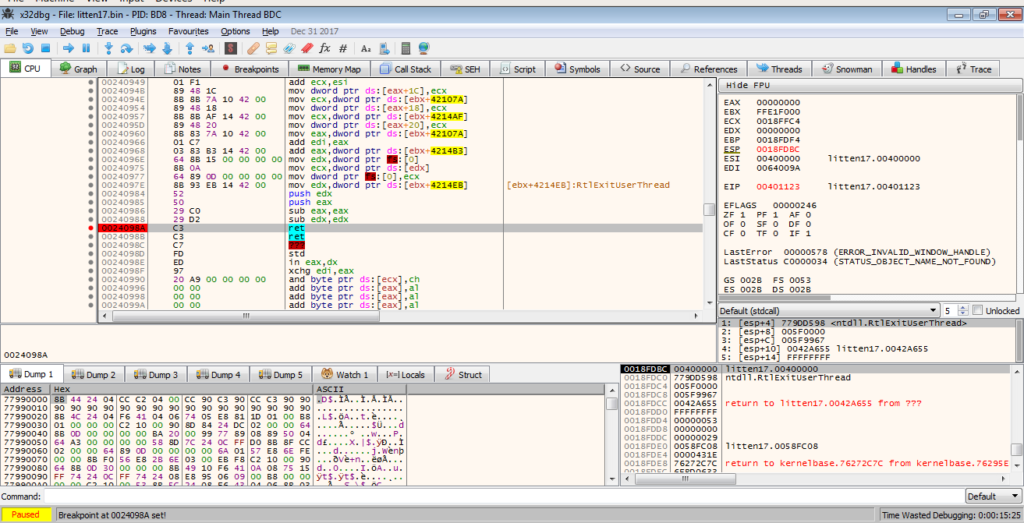
Once we follow the jump, we are met with several calls to [ebx+xxxxxx]. Each of these could jump to the unpacked EXE, however as we progress further on, it is clear that these are simply calls to Windows API functions. Notice the call to EDI? EDI is pointing to a function that dynamically imports these APIs so that they can be called by the unpacking stub. The result is stored in EAX, and as seen in the image below, this specific call imported the API RtlExitUserThread.
Scrolling down a bit, we can see a jmp eax, so let’s put a breakpoint on that and run to it, and then follow the jump.
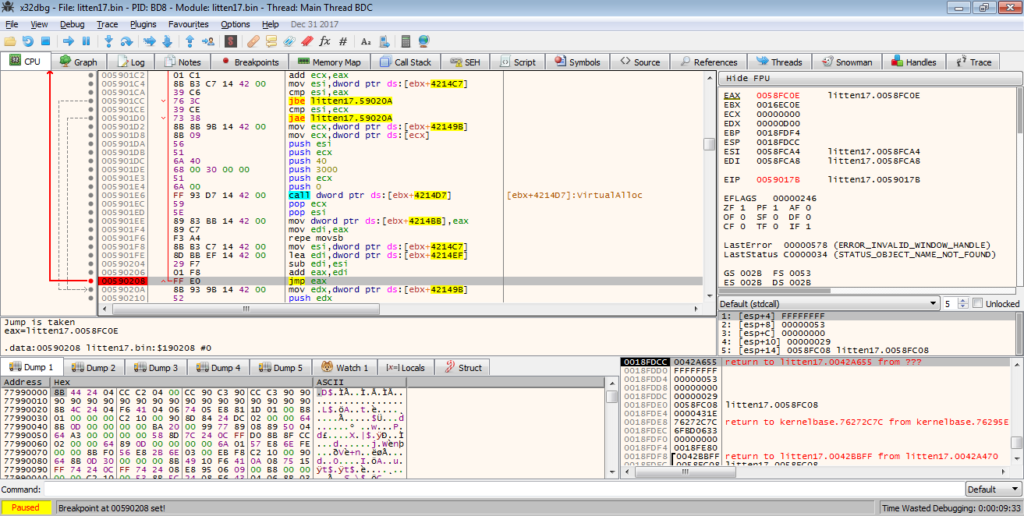
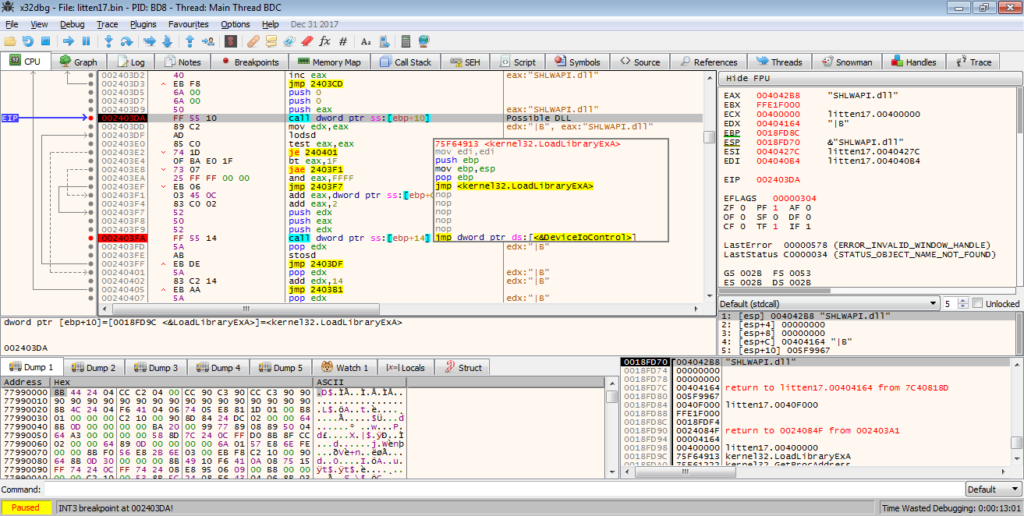
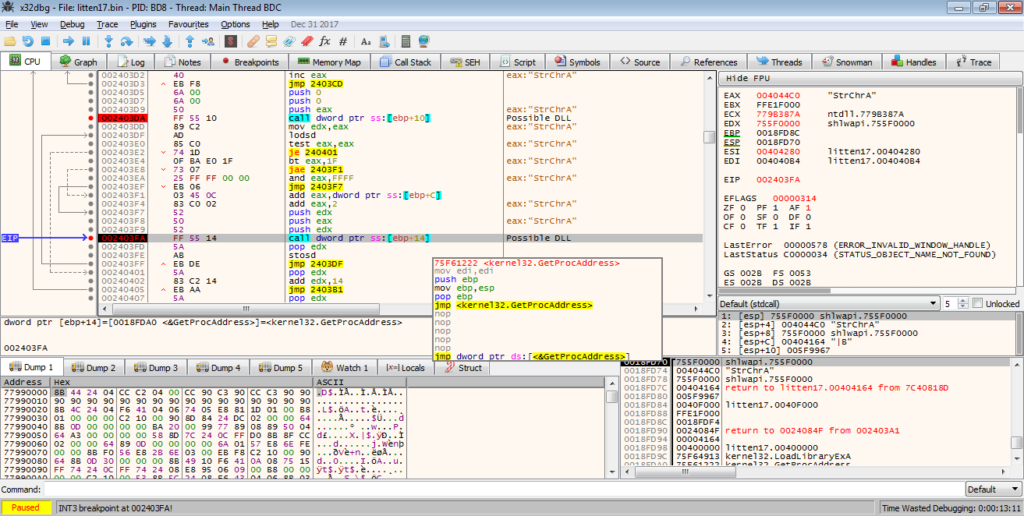
This jump takes us to a newly allocated region of memory, with more code. I didn’t want to examine each function, so I scrolled down until the ret instruction, and started examining the (local – not API calls) functions backwards. The last function did not seem likely to be the executable “executor”, as there was no call or jump instruction to a different region of memory, however the second last function had some calls to [ebp+14] and [ebp+C], so let’s put a few breakpoints on those.

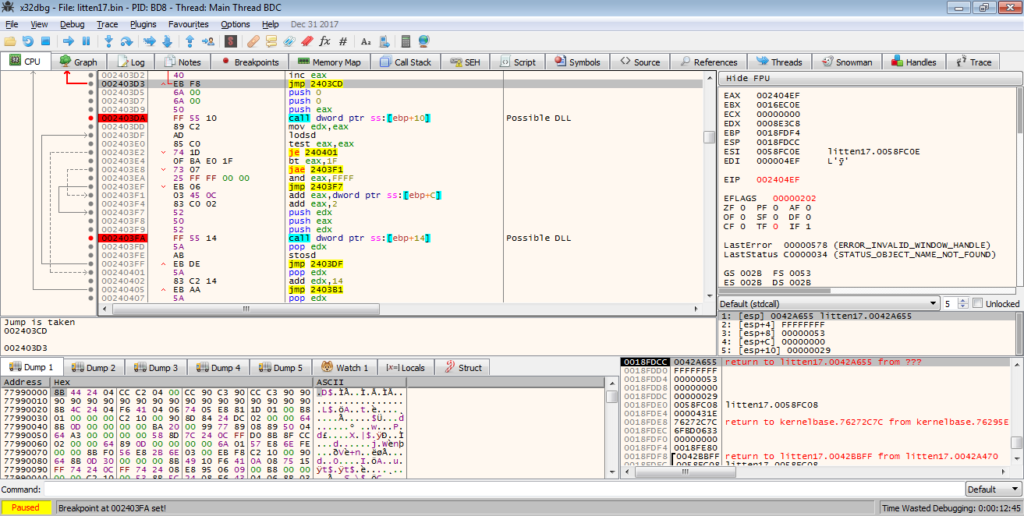
However, upon executing the program and hitting the breakpoint, it is clear that they are simply calling LoadLibrary and GetProcAddress.
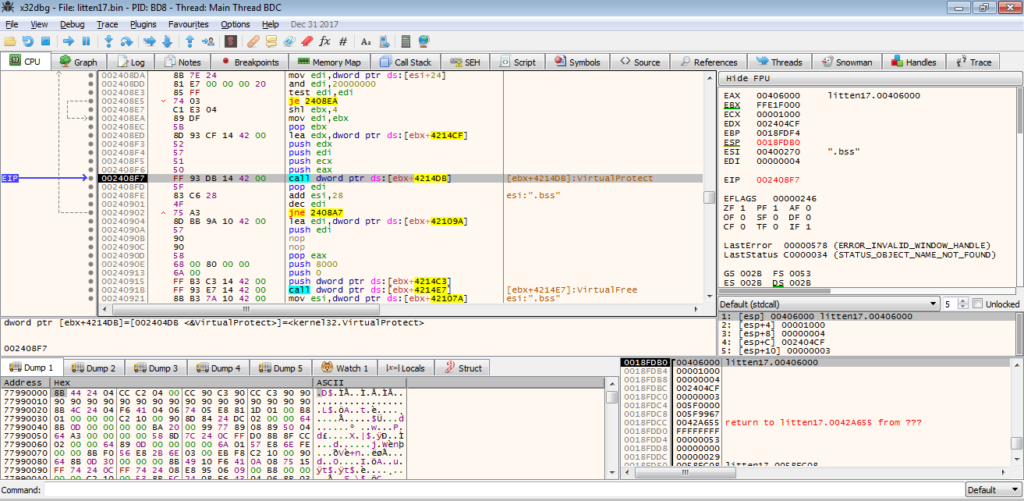
Therefore, we can simply return from this function, as it is just importing API’s, which isn’t extremely important to us yet. After exiting the function, there are several calls to API’s, in particular VirtualProtect. VirtualProtect is responsible for changing the permissions/protection of different memory regions, so that they are readable, writable, or executable (can be one, two, or all three). In this case, we can see that VirtualProtect is being used to change the protection of the memory region at 0x00406000, which is the .BSS section. As I mentioned before, this unpacker overwrites itself with the unpacked executable, so it is safe to say that we are extremely close to the unpacked EXE. We could dump it now, but there could be some extra unpacking going on, so let’s wait until we jump to the 0x00400000 memory region.
At this point, there isn’t much going on in the function, so we can simply put a breakpoint on the ret instruction and return from this function.
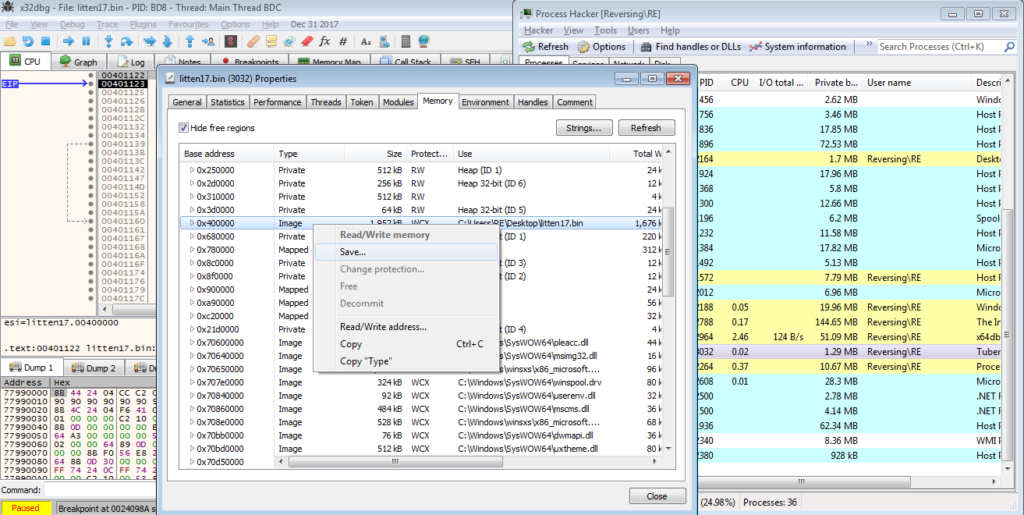
Upon exiting the function, you’ll notice the memory address is in the 0x00401000 region. This is the unpacked program! Now we can dump it out, so make sure you have Process Hacker open, although you can dump it from x32dbg.
To dump it from memory, simply double click the process in Process Hacker, and right click the 0x400000 region of memory, and select Save.
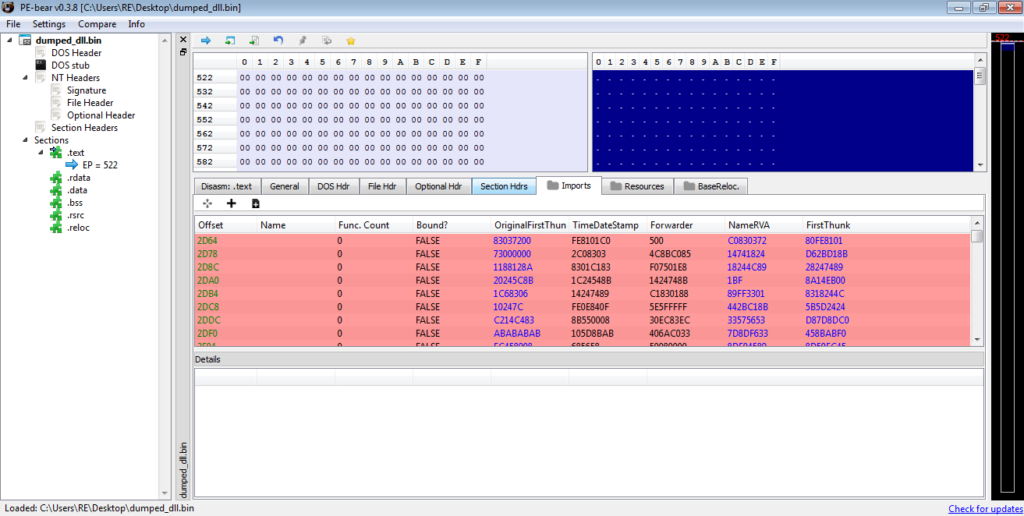
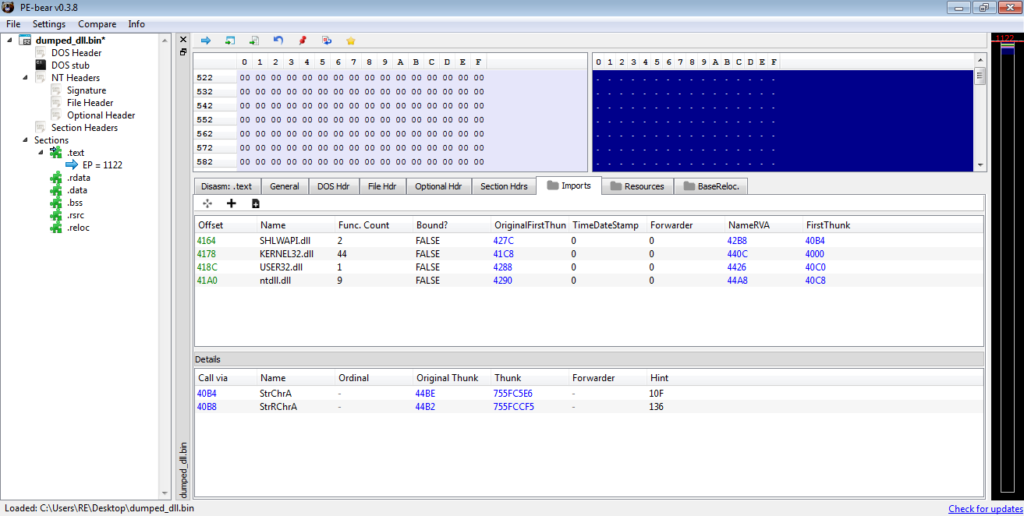
Now we can open it up in PEBear and unmap the dumped file. Upon doing so, you can see that the imports have not been successfully resolved by PEBear. This is why we need to unmap the file. When a program is about to be executed, it needs to be mapped in memory, so that it can be interpreted correctly. Therefore, PEBear is unable to resolve the imports until we unmap it.
To do so, we simply change the Raw Addr. so that it matches the Virtual Addr., and then change the Raw Size accordingly. This should result in something looking like the image below.
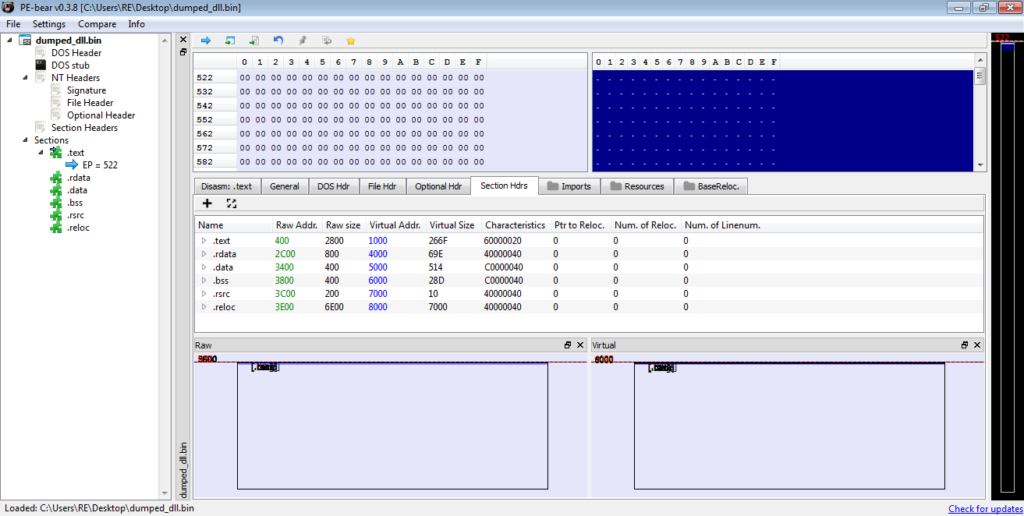
We can check the imports and sure enough, there are 4 imported DLL’s, meaning we have the correctly unmapped file. We can now save this to the desktop and congratulations! You have now successfully unpacked the first stage! Let’s open it up in IDA for further analysis!
Part 2: Analysing the Dumped Executable
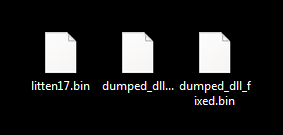
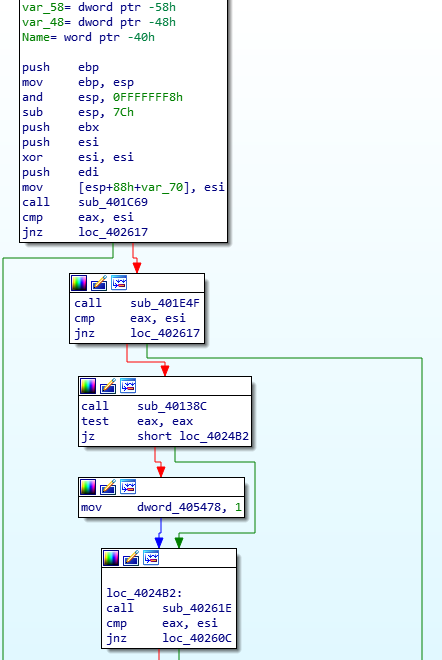
MD5 of Dumped Executable: 0063316975e55c765cd12e3d91820478Upon opening the file in IDA, we can see that the main function only calls one local function and then exits, so it’s not too difficult to find the malicious code. If you’re not sure if a certain sample is ISFB or not, one telltale sign can be found in the strings window. Most, if not all, ISFB payloads (version 2 – haven’t taken a look at version 3 yet so not sure) store a compile/campaign start date in plaintext that is used for string decryption. In this sample, the date is Jan 28 2019, so a relatively new sample at the time of writing this. I will go over the string decryption method soon, but first let’s take a look at what happens first in the function.
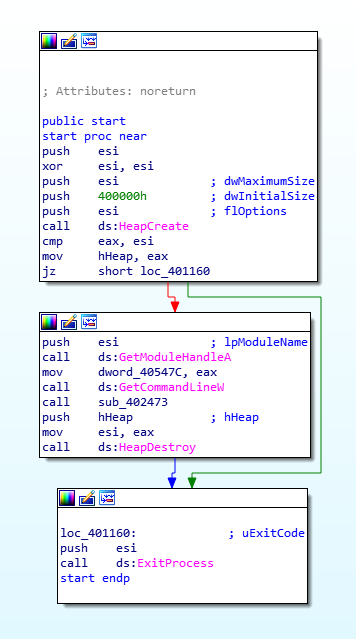
There are several functions called inside this function, so let’s take it section by section, so first let’s take a look at the first four functions. From the image below, it is clear that the return value of sub_401C69 (stored in eax) needs to match the value in esi, otherwise it will jump to the exit. The second called function – sub_401E4F – seems to do the same thing. The third function seems to be a check for something, as 1 is moved into a DWORD based on the result of a bit-wise AND (test performs a bit-wise AND on the two values, however it just sets flags based on the result, which is not stored) on eax. Finally, the fourth function seems to act in the same way as the first and second function, in the sense that the returned value is compared to the value in esi, and it will exit if the conditions are not met. Anyway, enough assuming, let’s actually take a look at these functions.
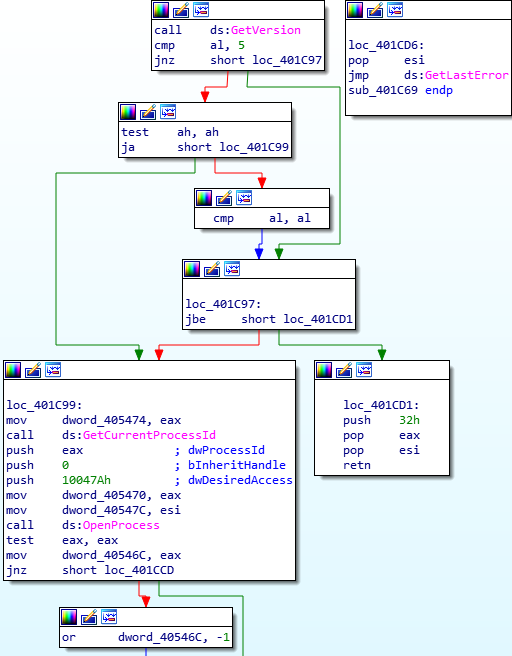
Taking a look at the first function (the main bit), we can see that the malware is opening it’s own process and storing the handle in a DWORD, which is set to -1 if the malware failed to open the process. This then returns back to the main function, where the returned result is compared against the value in ESI.
The second function is where things start to get interesting. In the image below, you’ll notice the compile date being moved into ESI, which, as I mentioned before, is used for string decryption. You might already know this, but for those that don’t, ISFB contains a .BSS section, which contains multiple strings that are all encrypted using a ROR-XOR algorithm. The XOR key is calculated based on a given date, and in order to decrypt the strings, ISFB needs to perform the calculations again to get the correct key, allowing us to easily reverse it. But first, let’s take a look at the two functions called beforehand.
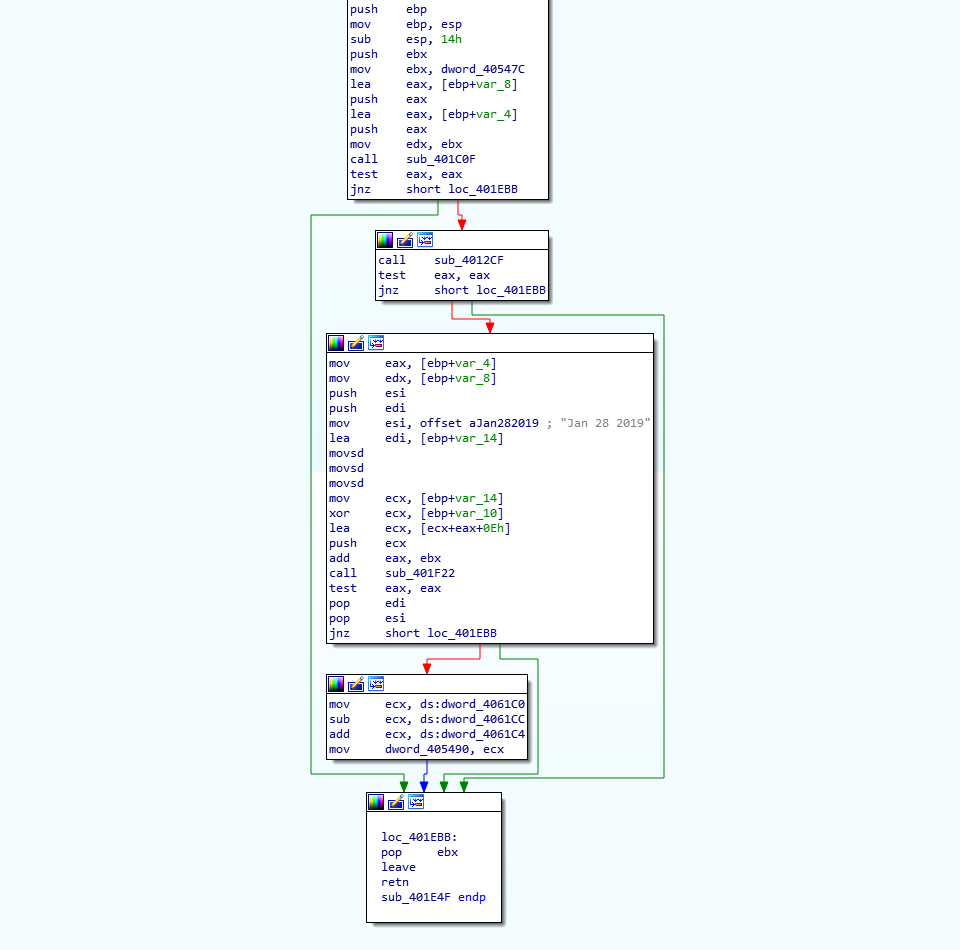
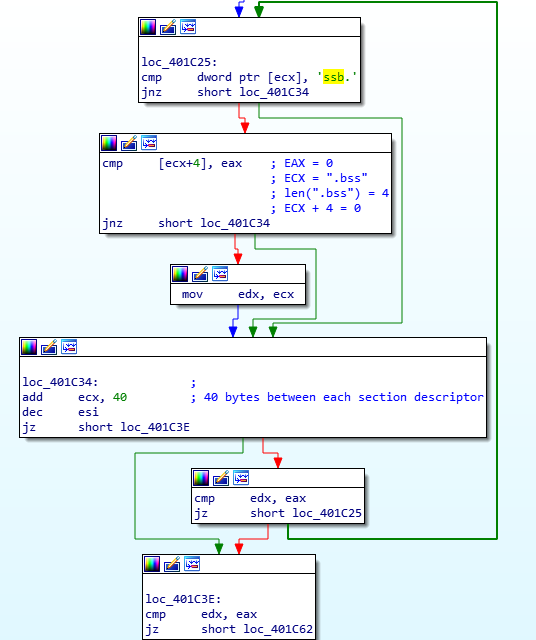
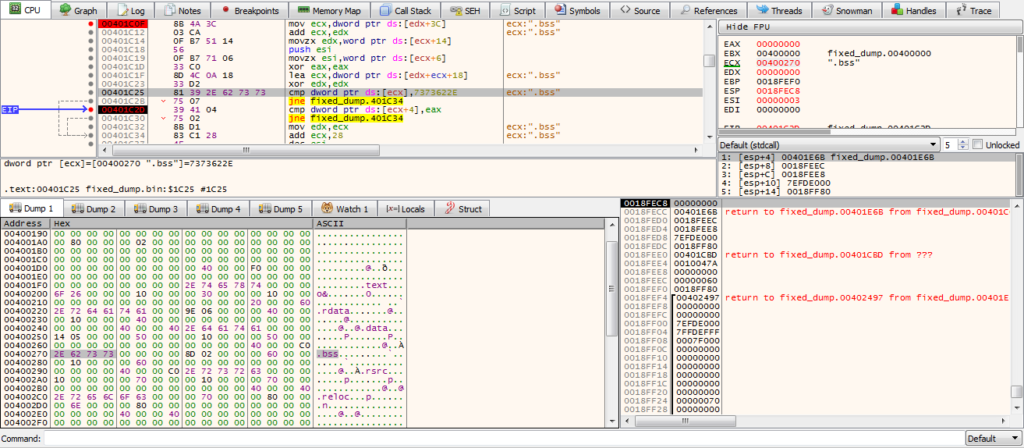
Looking at the first function, you’ll notice ssb. (endian issues, as it is stored as hex – actually is .bss) being compared to the value at [ECX], inside a loop. In order to decrypt the strings in the .BSS section, ISFB must first locate the .BSS section, and in order to do so, it simply reads it’s own PE header and gets the size and address of the required section. If the value at [ECX] doesn’t match .bss, 40 is added the the memory address in ECX, due to the fact that the spacing between the section descriptors/structures (.text, .data, etc.) is 40 bytes. The loop will the continue. If there is a match, the length of the string is checked, making sure that it is not longer than 4 bytes. The malware does this by checking the byte after the string, and comparing it to zero. If the string is the correct length, the memory address pointing to “.bss” is moved into EDX. If everything is successful, ISFB will get the address and size of the .BSS section and store it in memory. In this case, the address is 0x6000 (add this to the image base and you will be able to locate it), and the size is 0x1000. If this is still difficult to understand, there is an image of what the section table looks like in x32dbg – this should help you to understand how it is able to get the address and size.
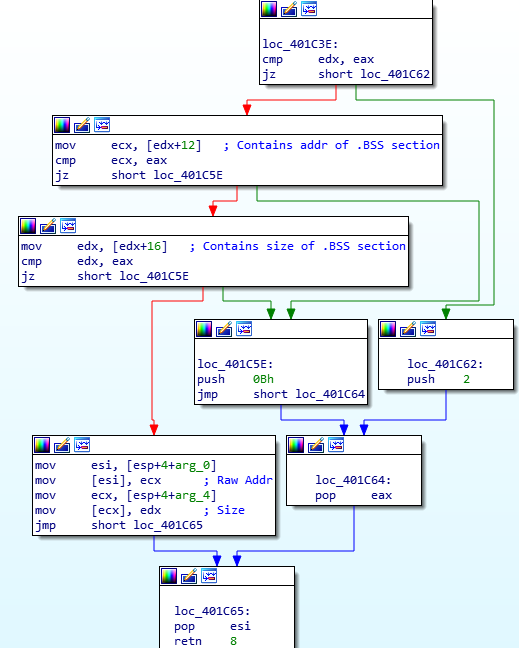
With that function analysed, let’s move onto the next one. The main purpose of this function is to add a vectored exception handler using AddVectoredExceptionHandler. The second argument is a pointer to the handler function that will be executed when the program runs into an exception, so lets take a look at the function Exception_Handle_Function.q
This function checks the value of the exception – whether it is an EXCEPTION_ACCESS_VIOLATION or EXCEPTION_SINGLE_STEP, however they both end up executing the same function, so lets move into that function.
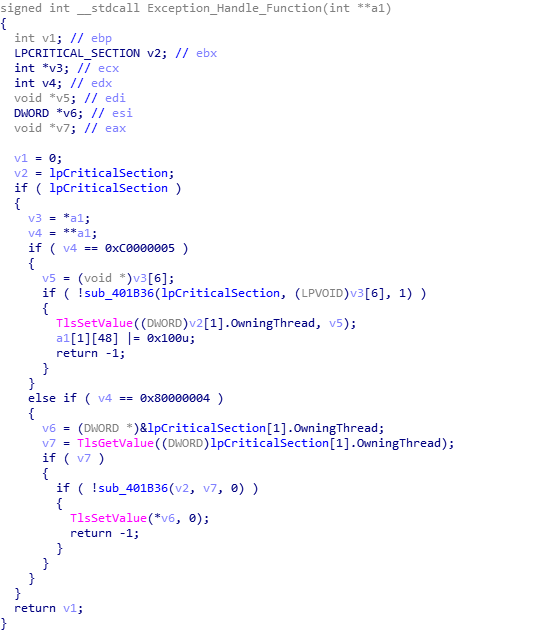
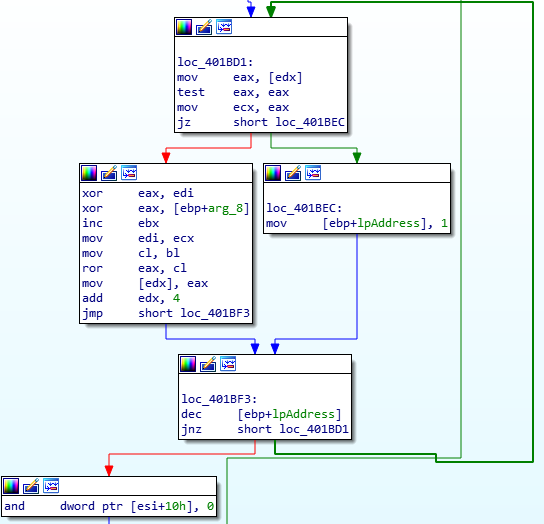
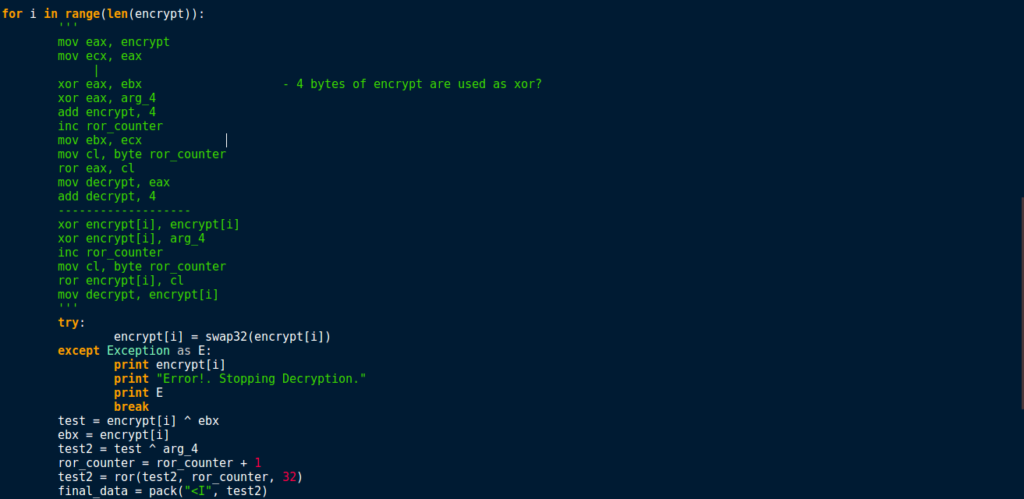
The important part of this function happens soon after it is executed. In the image below, you’ll be able to make out a loop, as well as two XOR instructions and a ROR instruction. This is the BSS section decryption – the XOR key that is created later on is actually arg_8, so take note of that. So, now we know that there will be an exception that is caused at some point, which will in turn execute the BSS string decryption function. Now we have this information, we can move onto reversing how the XOR key is created from the compilation/campaign date.
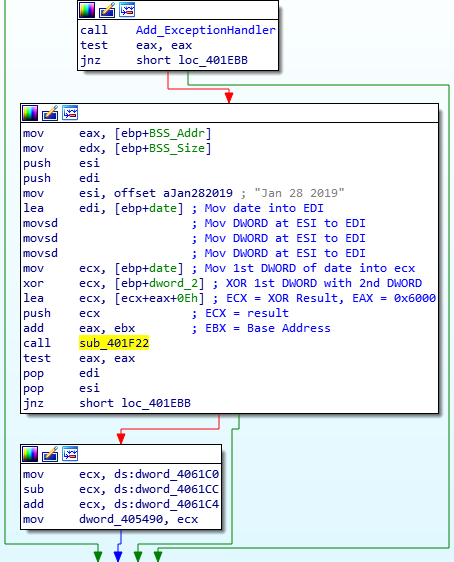
As the XOR key is based off of the date, thats where we need to look. First, the address of the BSS section (0x6000) is moved into EAX, and the size of it (0x1000) is moved into EDX. Then, the memory address of the compile date is moved into ESI, and a memory address (pointing to an empty section of memory) is moved into EDI. The compile date is then moved into that empty region of memory, using MOVSD, which moves a DWORD from the memory address in ESI to the memory address in EDI. Next, the first DWORD of the compile date is moved into ECX, and this is XOR’ed against the second DWORD of the compile date. Then, the result of this is added to the address of the BSS section (0x6000 here) and the value 0xE. This is then pushed as the first argument for the next function that will be called.
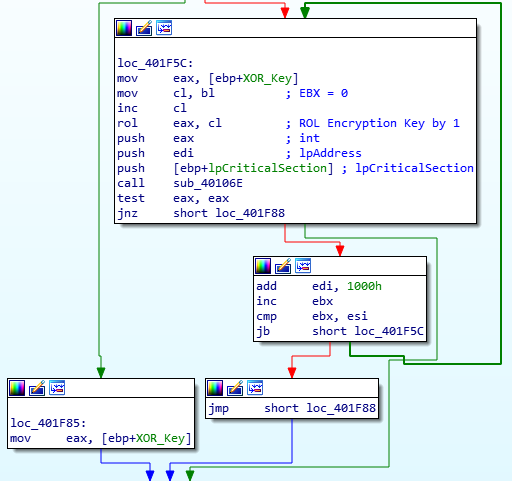
Taking a look at the function, arg_0 (the XOR key) is used in a Rotate Left instruction. Here, we see BL being moved into CL, which is incremented by 1 and used to rotate the XOR key left by 1. This results in the final XOR key that is used to decrypt the BSS strings.
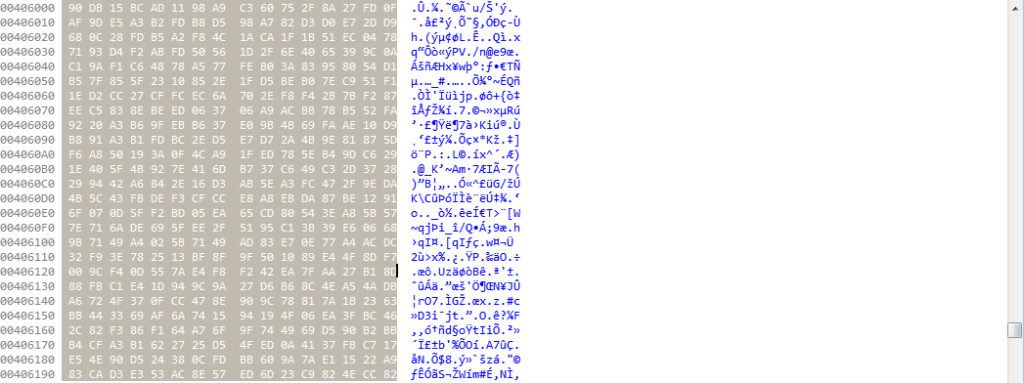
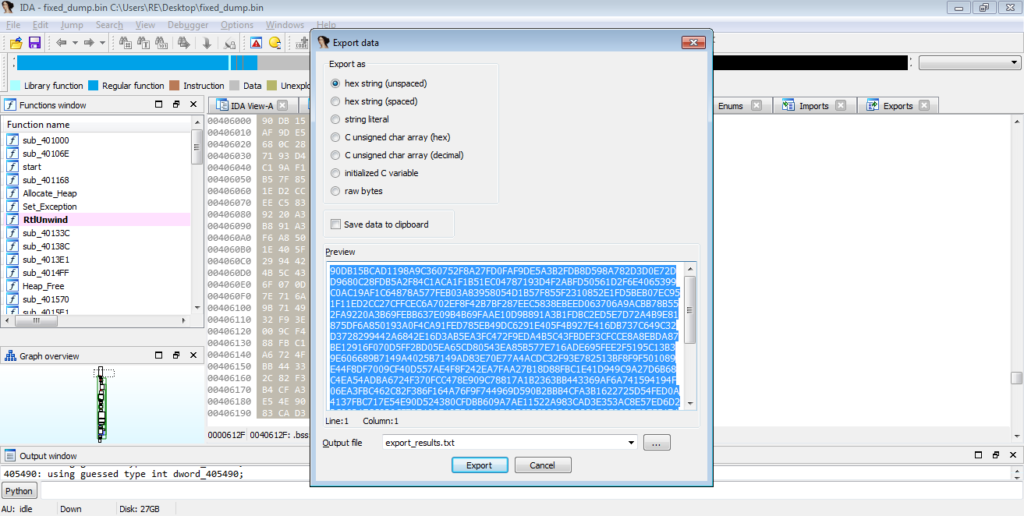
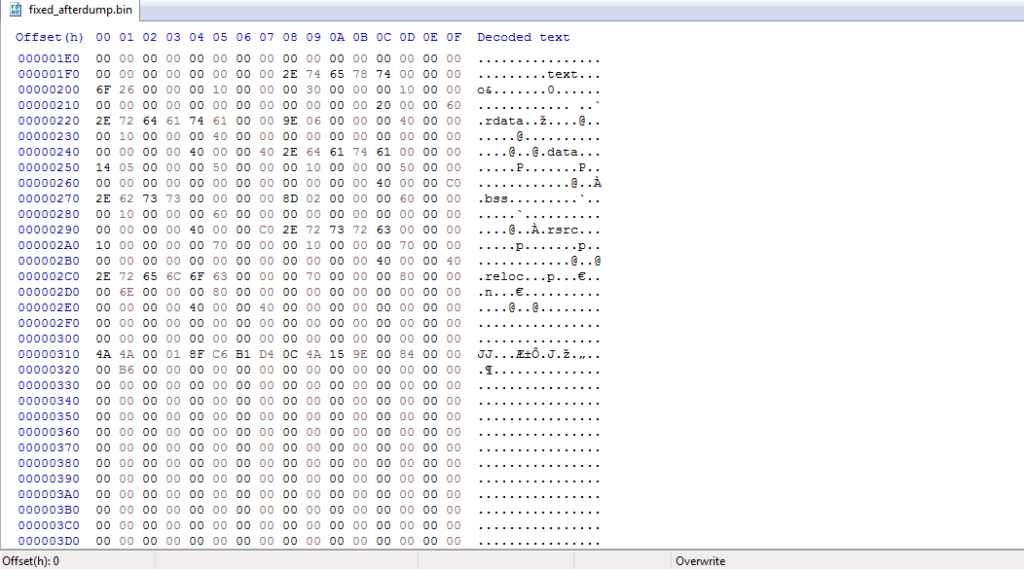
Once we have performed these calculations, we get this as the key: 0x249d730c. Whilst it is possible to get the strings from a debugger and copy it over to an IDA instance, I prefer to replicate custom routines using Python. I’m currently polishing up the decryption script I have been using, and when it is complete, you can get it here (my GitHub). Simply put, the algorithm decrypts the data in DWORDs, using a mixture of XOR’s and rotate right (ROR) instructions. First, we’re going to want to copy out the data in the BSS section. View it in the hex editor mode, select the entire section (where there is data), and then go Edit->Export Data, and you can copy the unspaced data. Next, we need to parse this blob of data so that we can decrypt it.
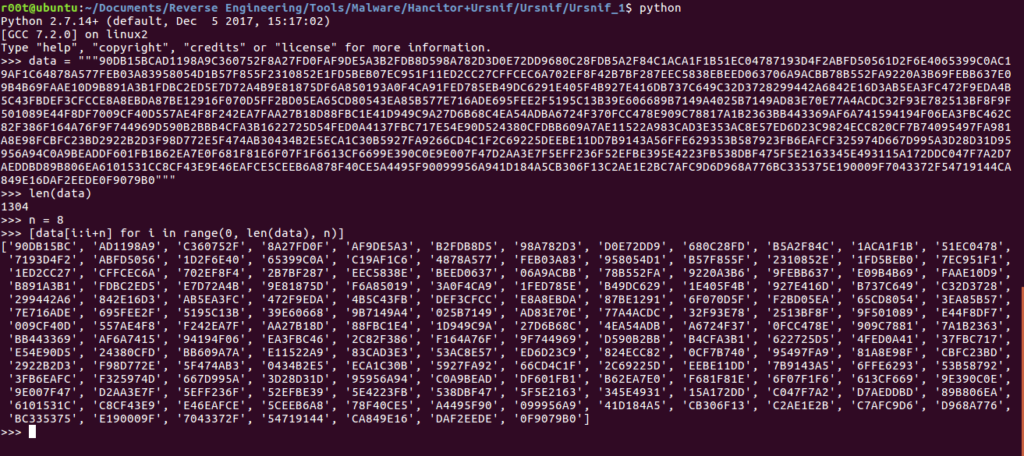
To parse it, I will be using python. All we need to do is split the hex bytes by 4, and store that in a list. This means each value will be a DWORD. If you follow the commands below, you should be able to get the output seen in the image.
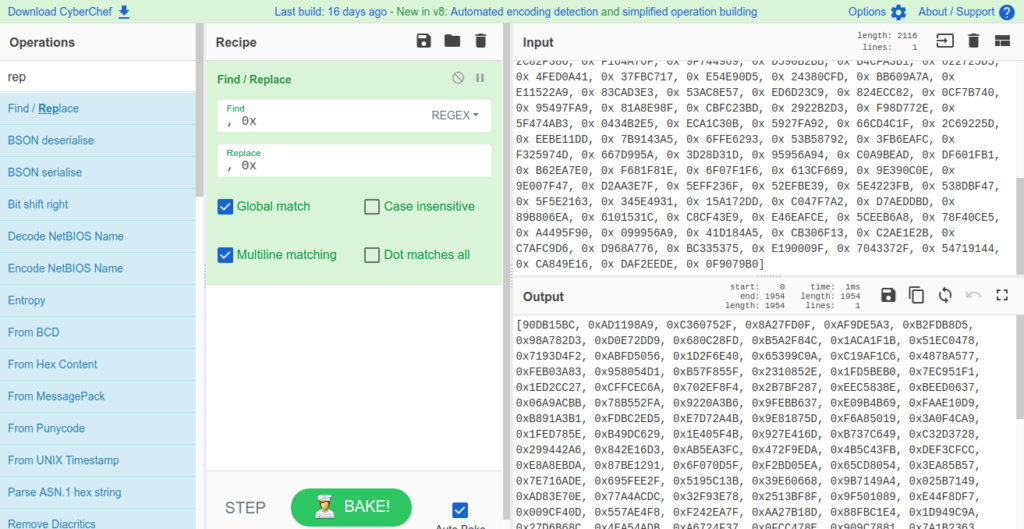
Next, we’re going to use CyberChef to do a bit more fixing, although we will be replacing different characters, so that there is an 0x before every DWORD, and so Python won’t treat the list as a list of strings.
So now you should have a suitable list of hex DWORDs which we can then decrypt. In order to decrypt it, you simply have to copy it into the script and make sure the key is correct, and then it will decrypt and spit out the raw data, as well as a list of integers, and you will see why just now. In the image below, you can see the decryption part of my script, which isn’t too complicated, so if it hasn’t gone up on my GitHub yet, it shouldn’t be too difficult to replicate.
Once the script has decrypted the data, the output looks like this:
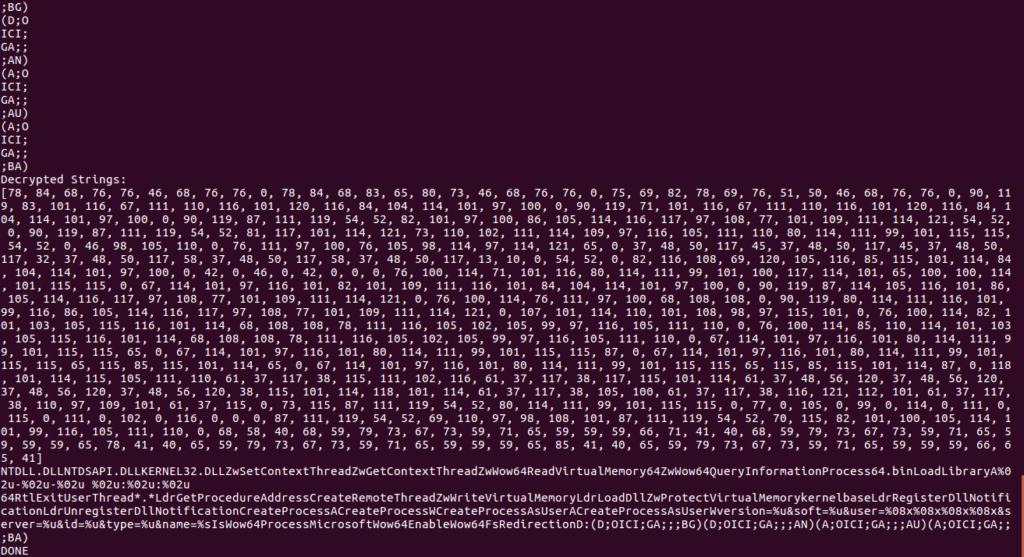
So now we can copy the decrypted strings over to IDA. There is an extremely basic IDA Python script in the image below, which overwrites bytes at dest with bytes of data in data. The list data will contain the integer values that our script printed to the terminal, so you can simply copy it from there and paste it into the document.
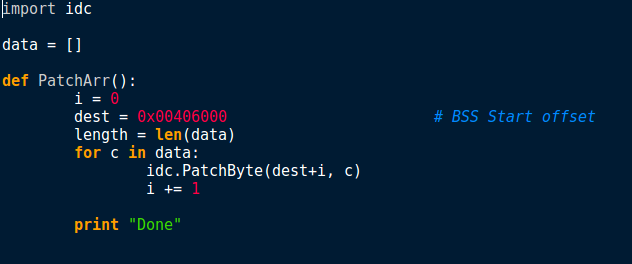
From there, we need to import it as a script/module in IDA, so you can do that either by importing the file, or by copying the text and pasting it into the box as shown below. All you need to do then is click Run, and it should be imported – although we physically have to call the script, Run won’t execute it – at least not in this case.
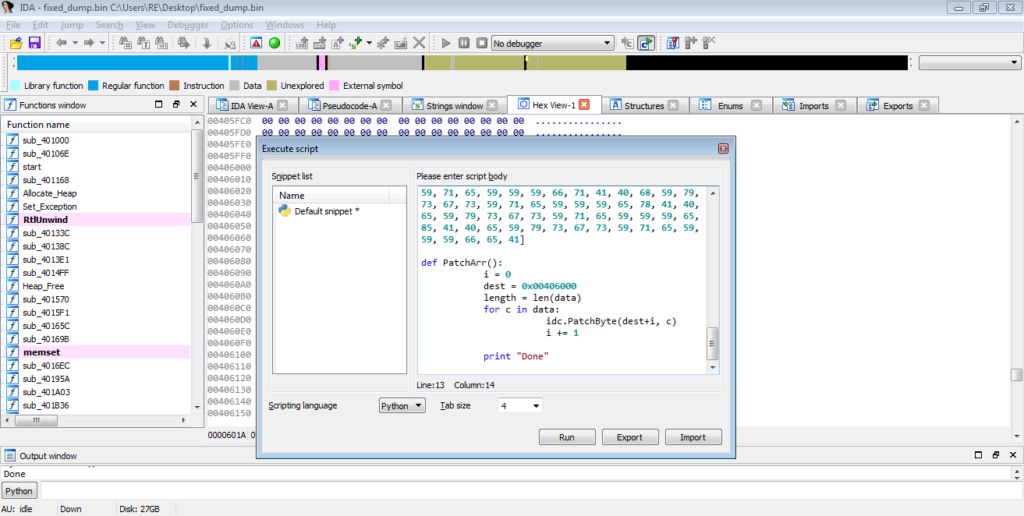
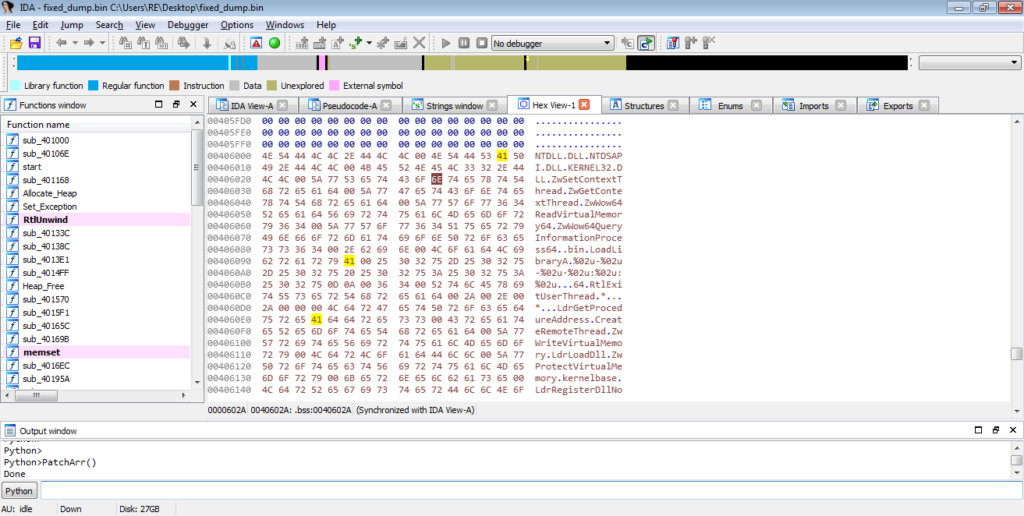
Upon typing PatchArr() into the console and hitting enter, the script should overwrite all bytes in the BSS section with our decrypted strings, so you should see something similar to the image below.
We can then reanalyse the payload, by going Options->General->Analysis->Reanalyze Program, and it should recognize most of the strings, although there will be the occasional error.
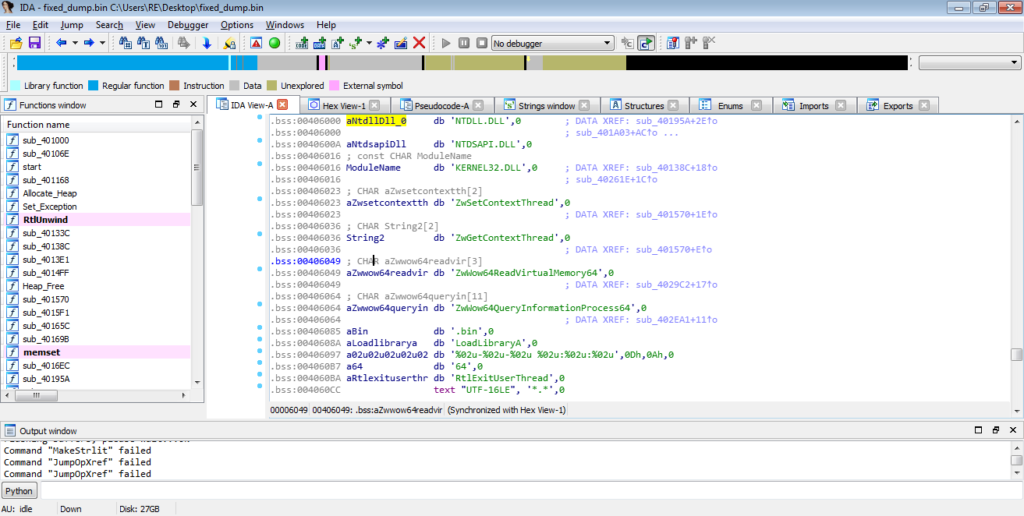
With the newly decrypted BSS section, we should be able to analyse the rest of the payload without issues.
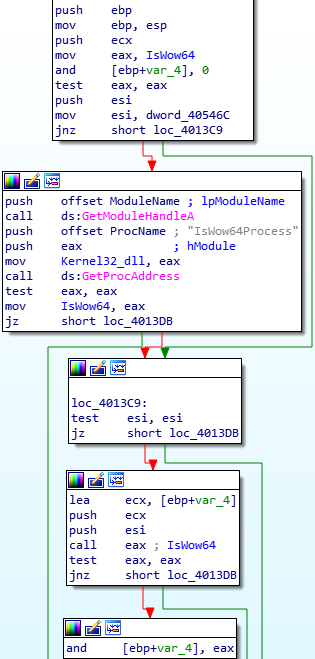
Once the strings have been decrypted, ISFB then calls a function that utilizes one of the decrypted strings – IsWow64Process. As you probably have guessed, this checks to see if the architecture of the system is 64 bit or not. The result (stored in EAX – 1 if x64, 0 if not) is then tested. If the system is not 64 bit, the variable var_4 in the graph below is used in an AND operation with EAX, which would be equal to 0, meaning the value in var_4 would be 0. If the system is 64 bit, this is skipped. Then, regardless of the system architecture, the value in var_4 is moved into EAX, which is the return value.
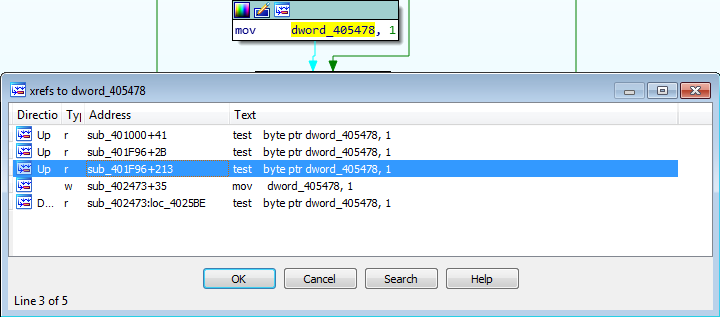
If we back out of the function, we can see EAX is tested again, and if the result is not zero, the value 1 will be moved into the DWORD dword_405478. As the system I am running on is 64 bit, dword_405478 will contain the value 1. If we search for cross references to this DWORD, we can find test instructions that use it. Therefore we can determine this is an indicator of the architecture.
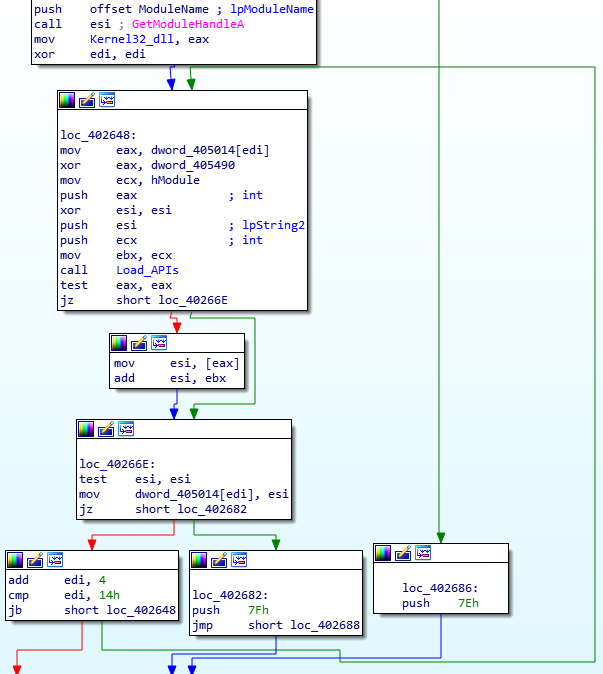
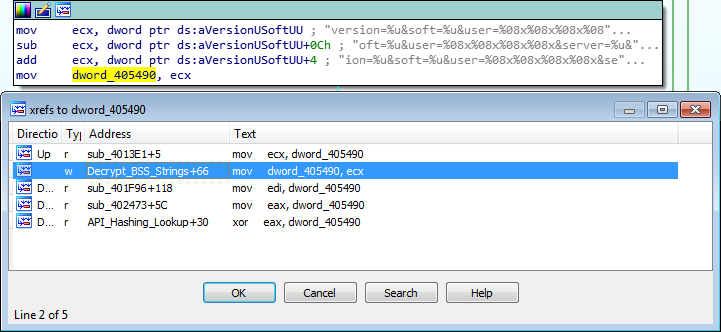
The next function that is called is quite complex. In a nutshell, this function is responsible for getting the address to a select few API calls. To do this, it uses a list of predefined values, a “key”, and a hashing routine. First, let’s take a look at the key and find out what it is. Looking at the image below, just before the value in hModule is moved into ECX, EAX is XOR’d with a DWORD inside the binary, however upon viewing this DWORD, it is empty – this means it is resolved dynamically.
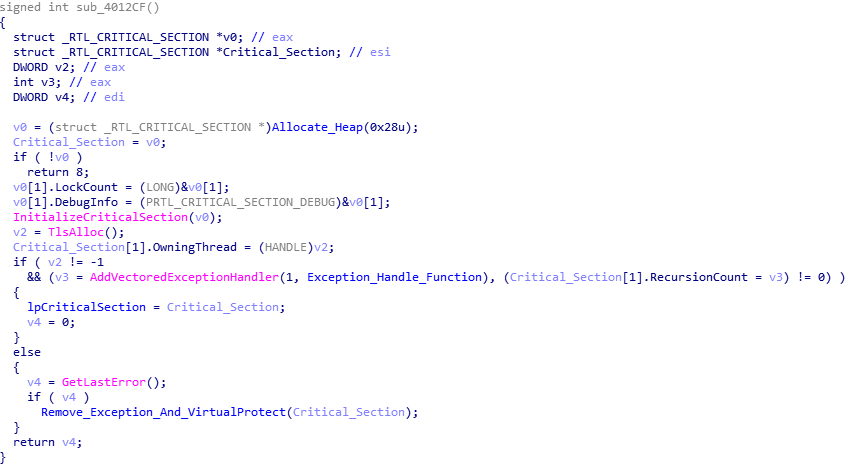
To find out what this DWORD will contain, we need to find cross references to it – specifically, we are looking for a reference to it being used as the destination in a MOV instruction. Luckily enough for us, it only appears once as the destination, inside the BSS Decrypt function. From the image below, we can see that a DWORD from a string is moved into ECX, which is then used in a subtraction and addition instruction. In this case, it may be much easier to understand what is going on by looking at it in a decompiler.
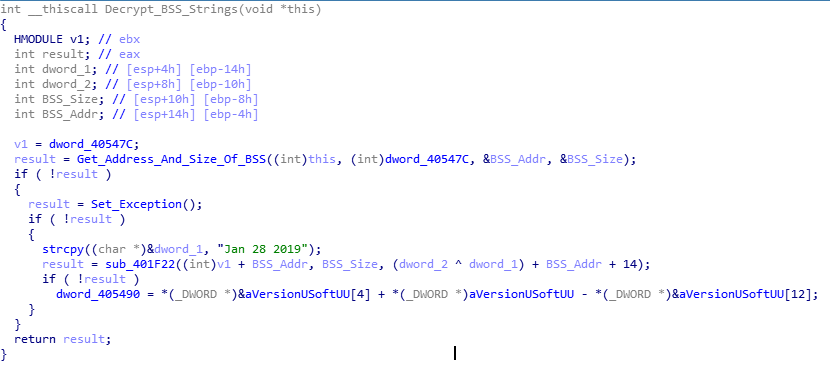
So, from the looks of it, we can get the key used by performing a simple operation, as seen below:
key = (dword string[4] + dword string[0]) - dword string[12]
key = ("ion=" + "vers") - "oft="
We need to convert these values to hex to perform addition and subtraction:
key = (0x696f6e3d + 0x76657273) - 0x6f66743d
key = 0x706E6C73
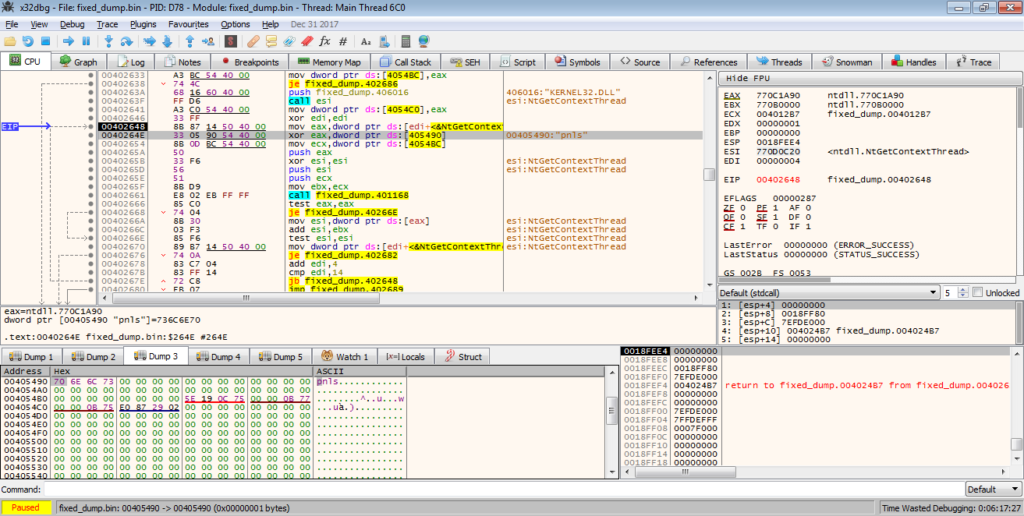
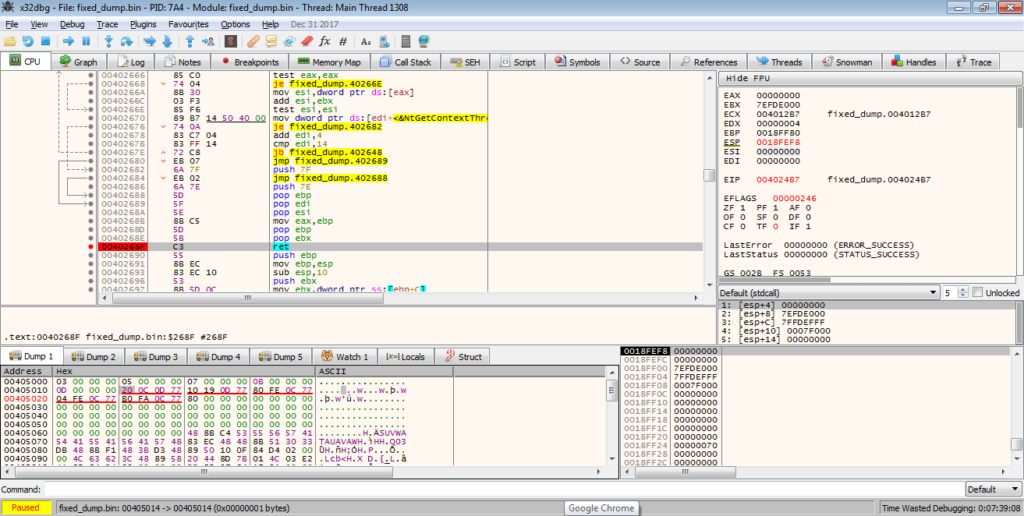
Convert the key from hex and we get this: "pnls"We can double check this by looking at the binary in a debugger, as shown in the image below.
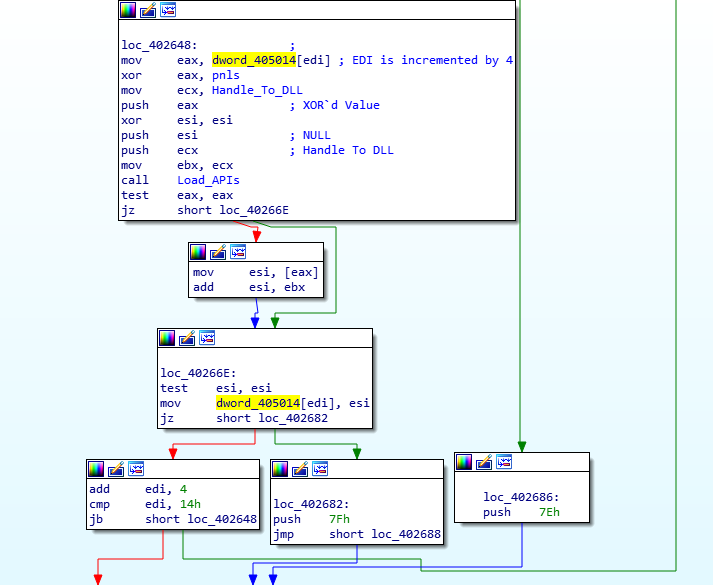
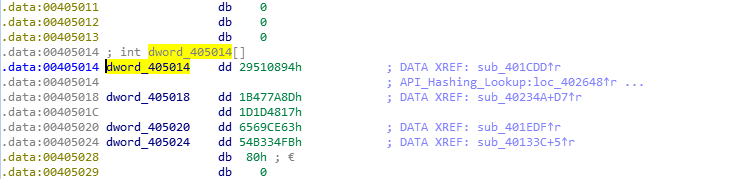
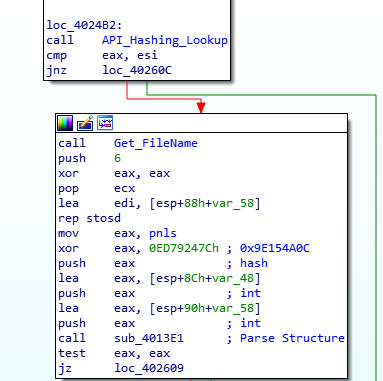
Now we have the key, let’s take a look at the values used for determining which API to import. This is quite simple to find, as it is already inside the executable. We can also see that EDI is being used as a counter, as each loop it is incremented by 4, until the value reaches 20, where it returns. This means there are 5 API’s in total that are looked up using this method. The values in the embedded list are all XOR’d by the key, which results in the hash lookup value used for comparison. So, from this, we can start examining the hashing algorithm to see how it functions and to locate what API’s are lookup up and stored.
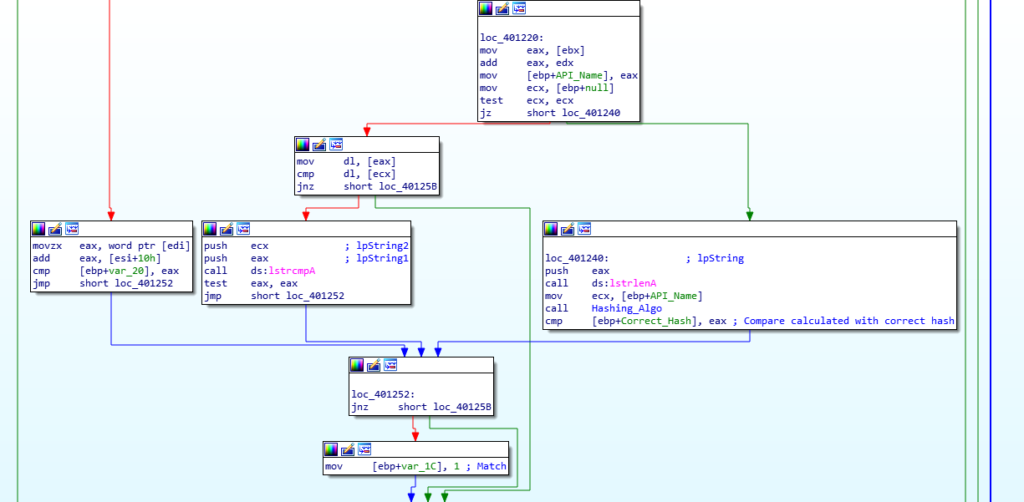
As the function is quite large, I will focus on the section that calls the hashing function. The three arguments passed to this function are; the address of the DLL, the value 0, and the correct hash for comparison. The function uses the base address to perform some calculations in order to get to the export table inside the DLL. From there, it loops through each of the exports and hashes the name of the export, which is then compared to the predefined hash. If the hashes match, the function retrieves the address to the exported API, and overwrites the predefined hash with the address for later use. If they do not match, the function simply continues onto the next export, until a match is finally discovered.
Taking a look at the actual hashing function, it is quite difficult to come to the conclusion (especially for a beginner) that the function is responsible for hashing, until it is run in a debugger. There is definitely something happening in this function from a static analysis perspective, as there are multiple logic instructions, but we can’t know for sure until we analyse it further.
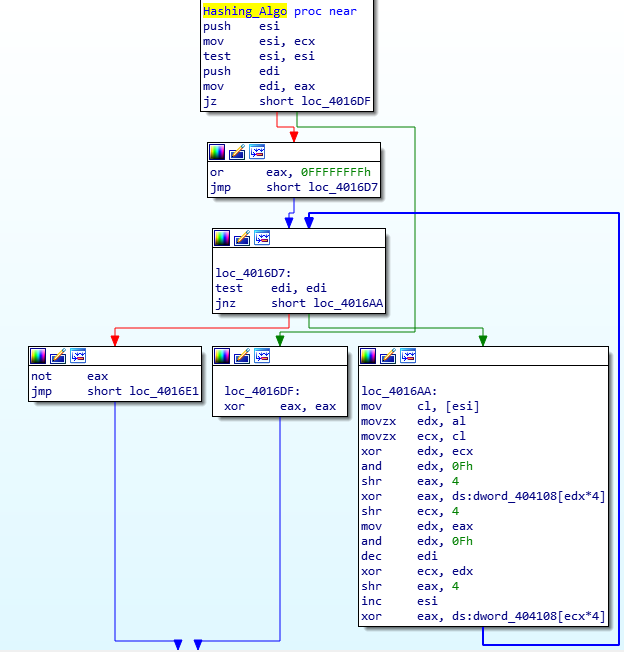
Taking a look in a debugger, it is clear that [edx*4+404108] and [ecx*4+404108] are values from a lookup table, as the XOR values used constantly change, however the values are repeated, and therefore we can determine that they are not randomized. Base64 encoding/decoding use lookup tables as well, so if you have looked at that before (or at least the psuedocode), you might be able to recognize the lookup table aspect here. When we take a look at the memory region where the lookup table is located, it is easy to see where it begins and ends. So, now we know that there is a lookup table, how do we find out the hashing mechanism in use?
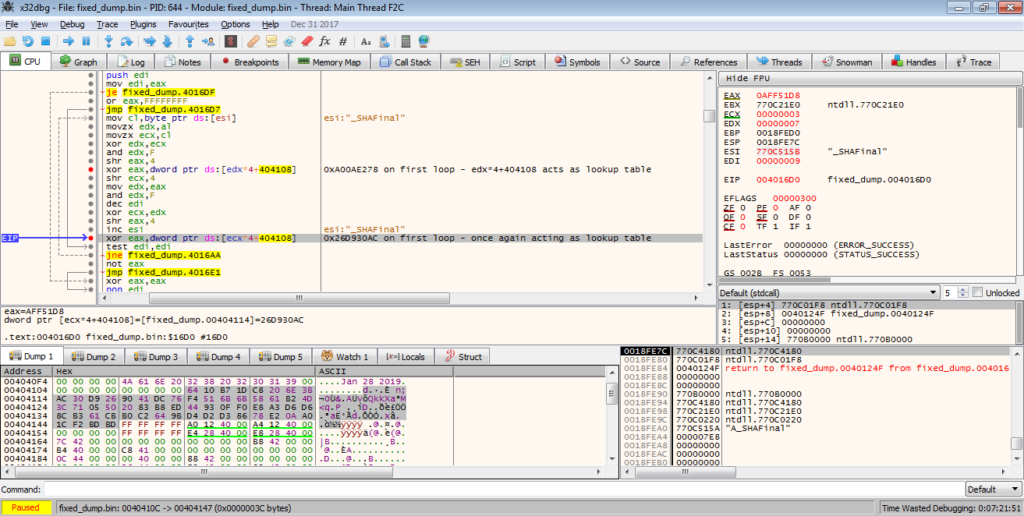
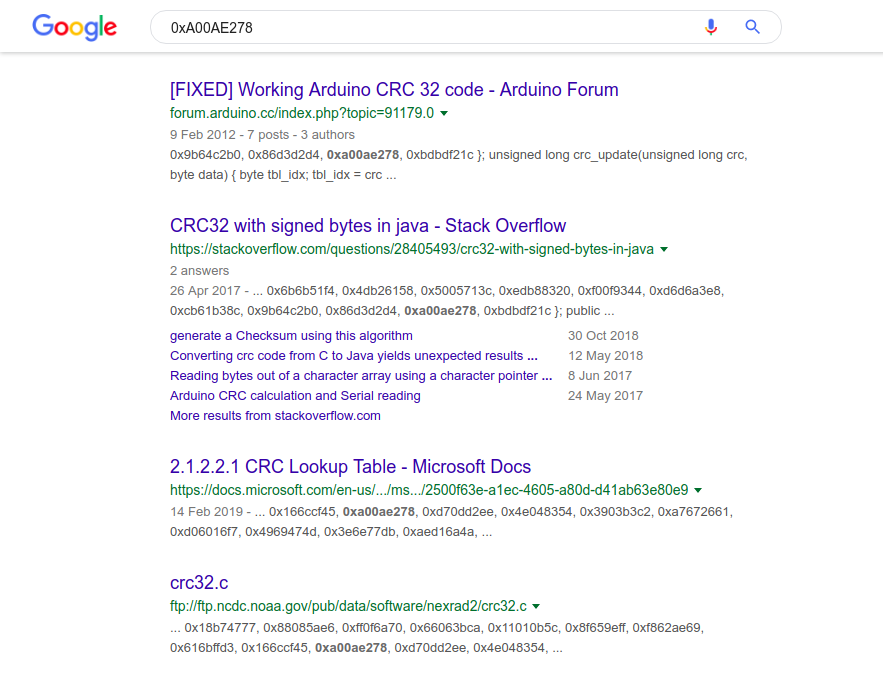
Typically, custom encryption and hashing implementations are quite difficult to determine, unless you know what you are looking for. As long as the algorithm is publicly available (such as AES or Serpent), and not a custom developed one by the author, there will almost always be specific values or instructions that stick out to those who have looked at crypto before – these are known as Constants. We will revisit these later (in the next post) when looking at the other encryption methods used in this sample, however to sum it up, it basically refers to values that must be used in the algorithm to achieve the correct results. In this case, let’s take one value from the lookup table: 0xA00AE278. We can run a quick search for this value online, and as you can see from the image below, this is definitely linked to CRC-32, although it is more of a variant – we just need to find out which variant.
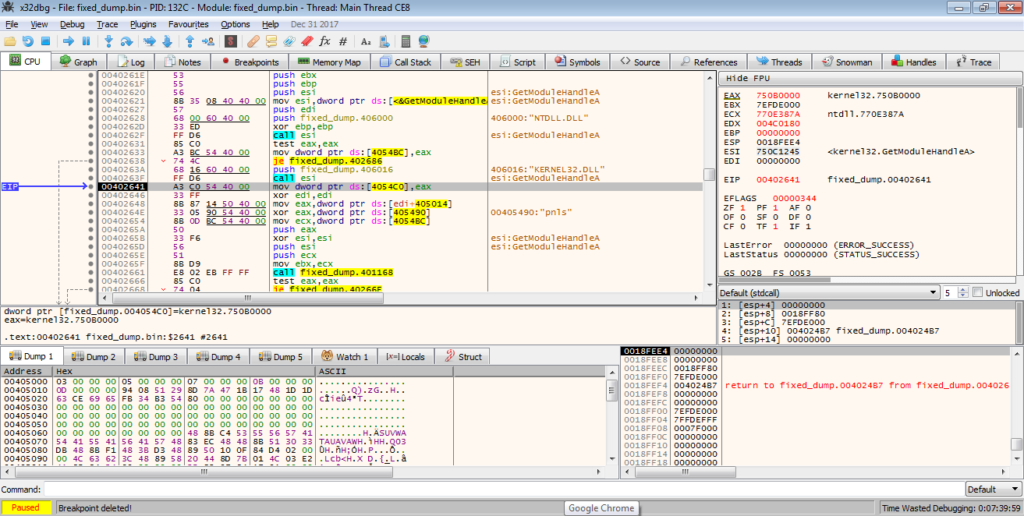
In this specific sample, the program loops through the NTDLL.DLL export functions and hashes them all until it finds a matching hash. What makes hashing worse is that hashes are irreversable, meaning the only way you can find the matching hash is by brute forcing – to do this you could hash each API exported by NTDLL until you found the matching hashes, but this is too time consuming, and it is quite simple to find the matching API anyway – all you have to do is put a breakpoint on the instruction that is hit if a match is found, and execute the program. Once the breakpoint is hit, you’ll be able to locate the correct API. From the image below, you can see the first API call that matches is ZwGetContextThread. We can now use this to get the variant of CRC-32 used.
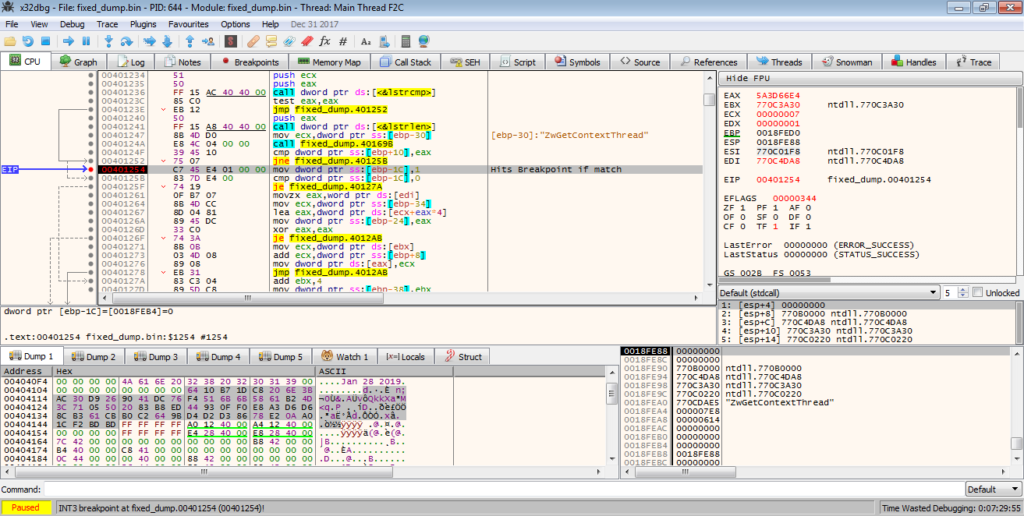
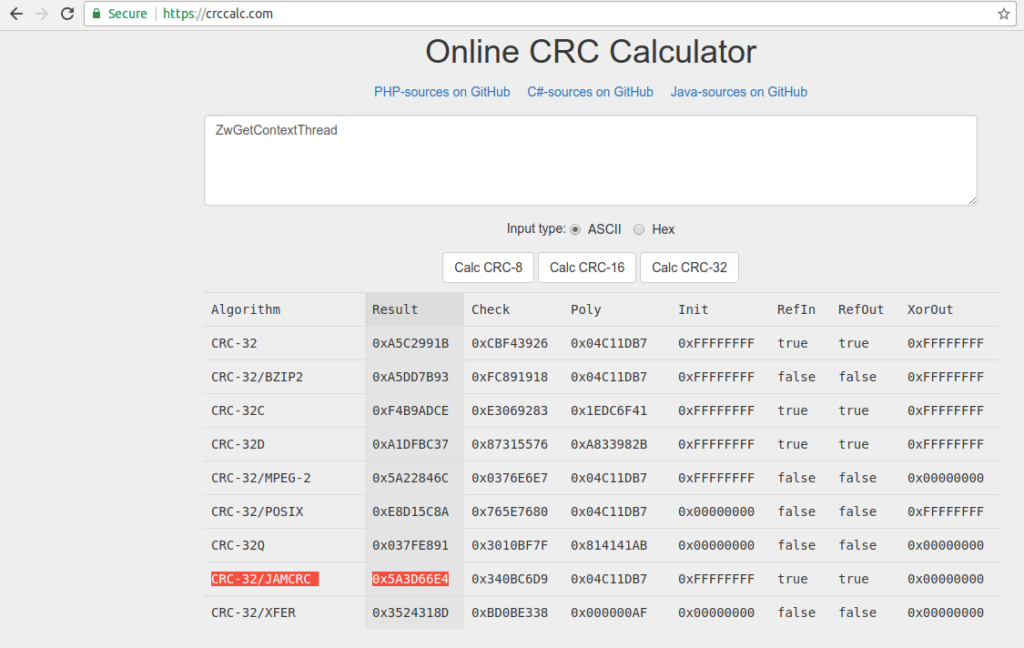
In order to do so, we can use this site, which is extremely useful. It hashes the input using several different variants of CRC-8, CRC-16, and CRC-32, allowing us to compare the value from the debugger to the output of the different variants. With the API name, ZwGetContextThread, and the required output, 0x5A3D66E4, we can find the variant used: CRC-32/JAMCRC.
As we can find out the matching APIs, there is no need to write a brute force script, although for families such as GootKit, this is sometimes necessary. So, the 5 APIs imported are: ZwGetContextThread, ZwSetContextThread, ZwReadVirtualMemory, ZwWriteVirtualMemory, and ZwAllocateVirtualMemory. With that, we can move out of this function, and onto the next.
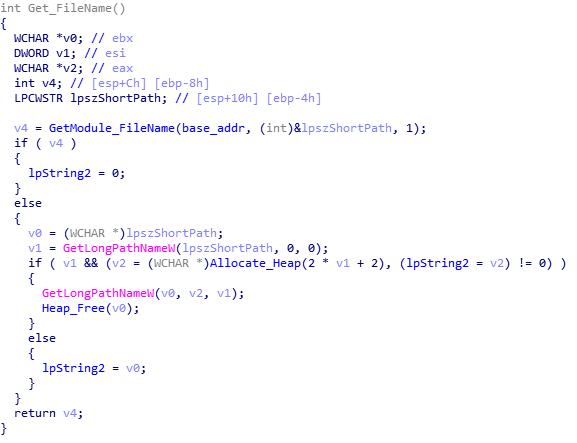
The next function simply retrieves the file name to store in memory, potentially for use later on in the sample. The next function gets much more interesting, so lets move onto that.
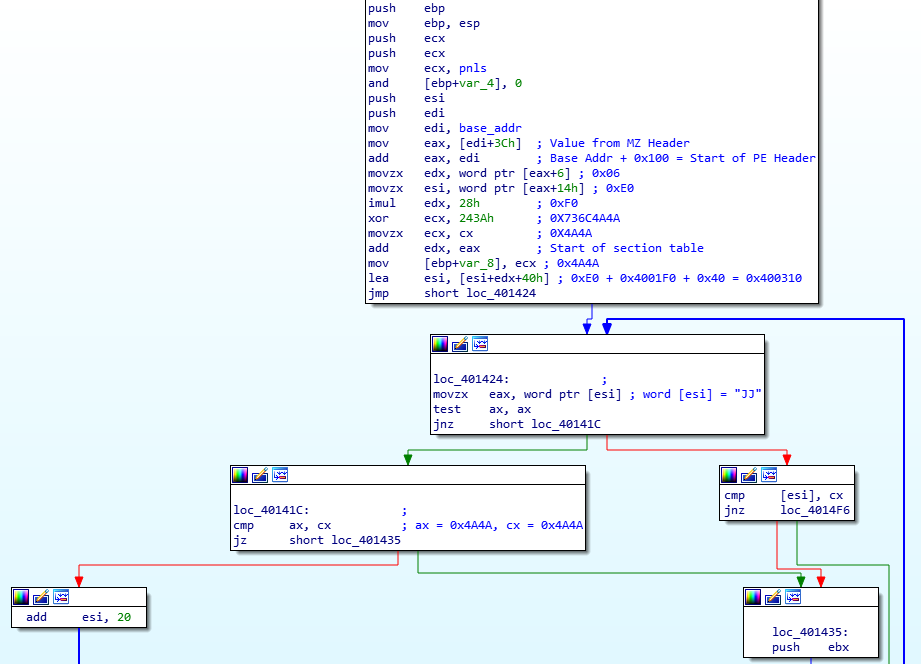
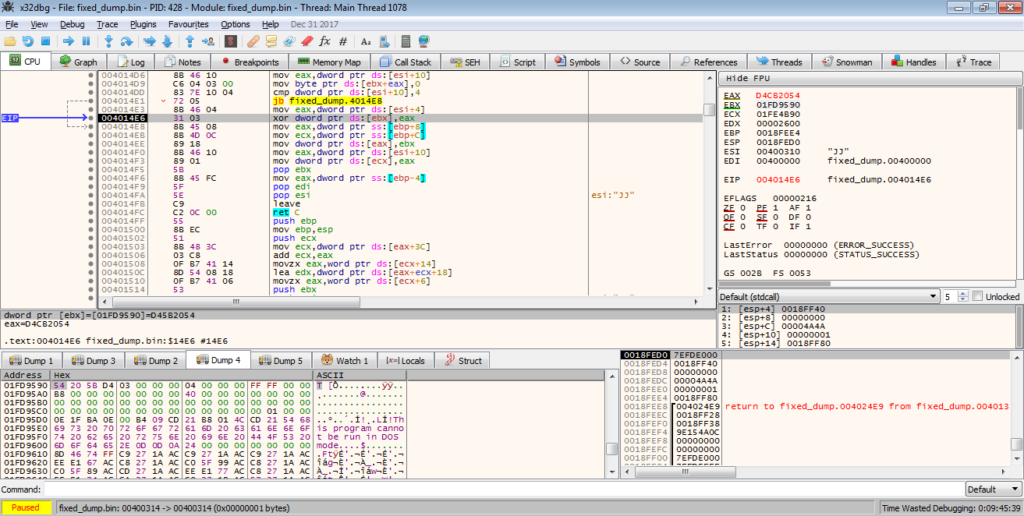
If you’ve looked at ISFB or read anything about it before, you might be aware of an embedded FJ, F1, or JJ structure that is located just after the section table. This structure contains pointers to appended (also known as joined) data, such as configuration information, an RSA public key, or even another executable. There are differences between FJ, F1, and JJ, although they are quite small changes. In this case, the sample is using an embedded JJ structure, identifiable from the magic value 0x4A4A (“JJ”).
The format of this structure is shown below:
Joined Resource Structure {
	WORD	Magic Value
	WORD	Flags
	DWORD	XOR Key
	DWORD	CRC-32 Hash
	DWORD	Address
	DWORD	Size
}
The parsed structure in this binary can be seen below:
Joined Resource Structure {
WORD 0x4A4A
WORD 0x0001
DWORD 0xD4B1C68F
DWORD 0x9E154A0C
DWORD 0x00008400
DWORD 0x0000B600
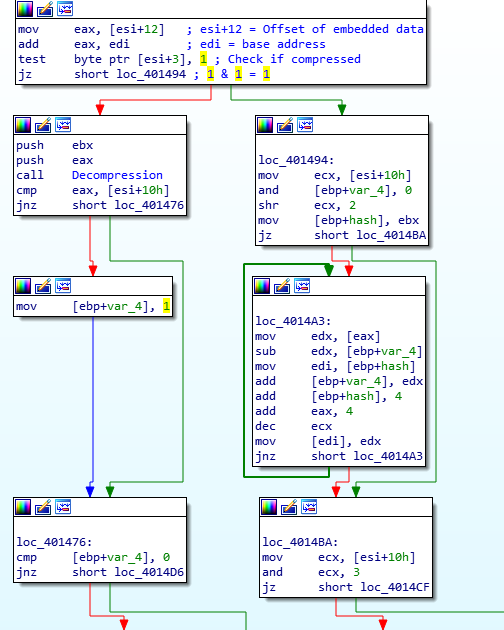
}The function we are looking at is responsible for parsing this structure and locating the needed data. The main argument for this function is the third one, which is the result of an XOR between the “pnls” string and an embedded hex value. The first and second arguments are simply the start and end of an empty region of memory, so they are not that important right now.
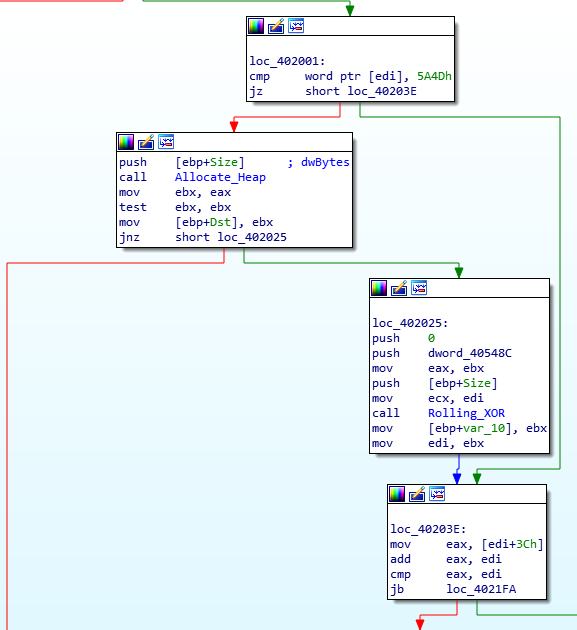
The first half of the parsing function traverses through the MZ and PE header until it has reached the resource structure located just after the section table. It then checks that the magic value is in fact “JJ” (0x4A4A), otherwise it will add 0x14 to the current address and try again.
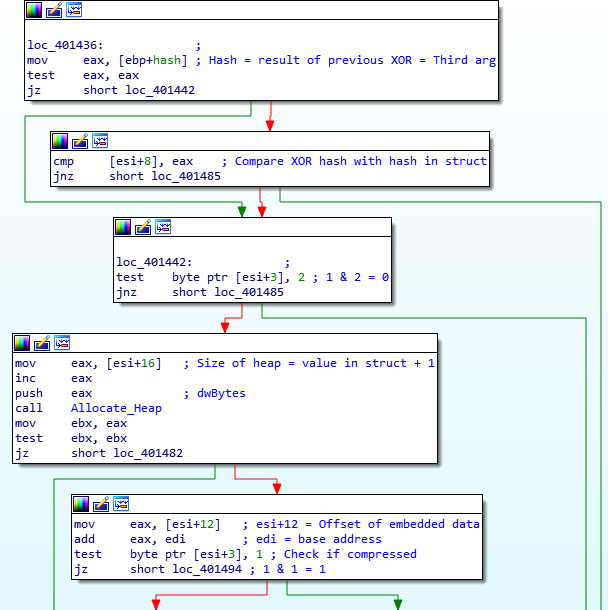
Once the structure has been located successfully, the function compares the third argument (0x9E154A0C) with the embedded CRC-32 hash, which is also 0x9E154A0C. If these do not match, the function will return or loop around again. If they do match, the function performs a bitwise AND on the structure flag and 0x2, which must return 0, otherwise the function will loop or return. If 0 is returned, a heap is allocated based on the size value stored in the structure. From there, it will get the full memory address of the joined data by adding the address in the structure to the base address of the executable, and then a bitwise AND is performed on the structure flag and 0x1. If the result is 0 the joined data is not compressed and is encoded, and if the result is not 0 (which in this case it is 1), the joined data is compressed. As the joined data is compressed in this binary, we will focus on the compression method.
The two arguments pushed to the function are the location of the compressed data, and the address of the newly allocated heap.
Looking at an overview of the function, you can see it is quite intricate and difficult to follow. Remember what I was saying about crypto constants earlier? They are also present in some, if not all, (de)compression routines, although it is much more difficult to identify the algorithm compared to encryption algorithms.
Searching through the graph, there are calls to the same functions several times over, but we are looking for a hardcoded value that is not stored in memory. Sure enough, after searching through the right branch, we can see a CMP instruction being used, comparing the value in esi to the value 0x7D00. Using this, we can search “0x7d00 compression” on Google and after scrolling down a bit, come across this site. Comparing this python code:
def lengthdelta(offset):
    if offset < 0x80 or 0x7D00 <= offset:
        return 2
    elif 0x500 <= offset:
        return 1
    return 0
To a section of the assembly:
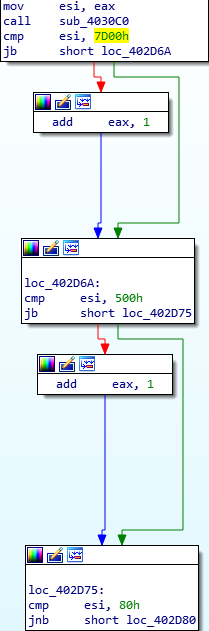
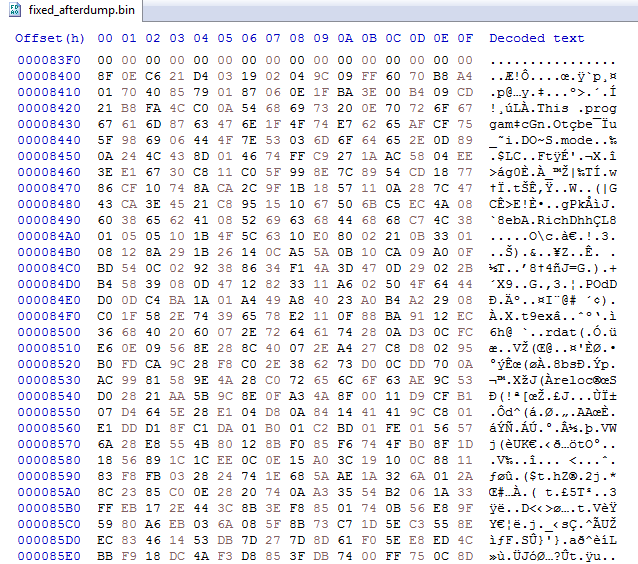
We can see some clear similarities. From this, we can deduce that the decompression algorithm used here is APLib, and with this knowledge we can write a simple extraction script to extract any joined data from the binary and decompress it using the great Python library Mlib, created by Mak. You might be wondering how I was able to determine if something was decompressed before even looking at the function. I have read up on ISFB and have also analysed it quite frequently, however it is quite easy to figure out that the joined data is compressed by simply looking at it. Opening up the binary in a hex editor and going to the location of the joined data, you might be able to recognize the string “This Program Cannot Be Run In DOS Mode”, although part of it is obfuscated. Recognizing compression also depends on the level of compression, however for the ISFB malware strain, APLib is the defacto compression method for now, so it is relatively simple.
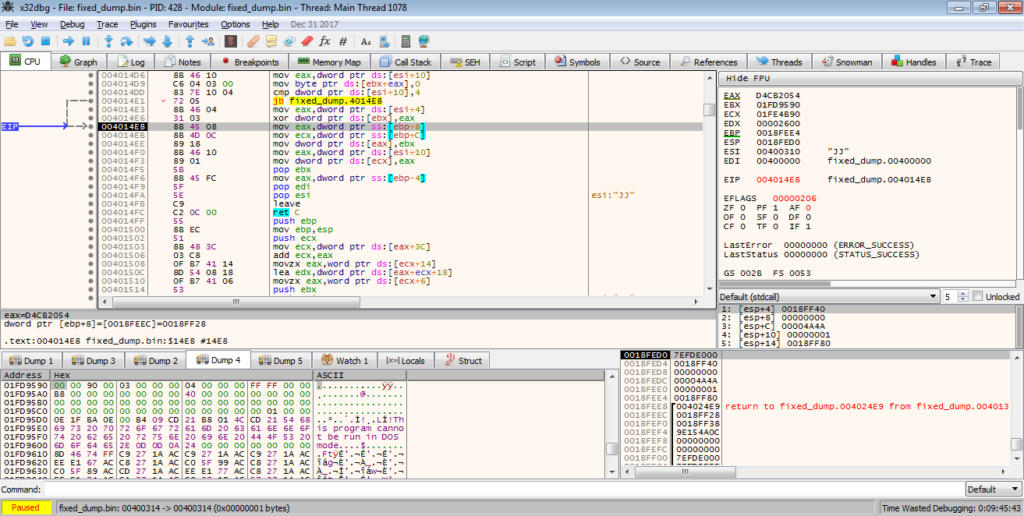
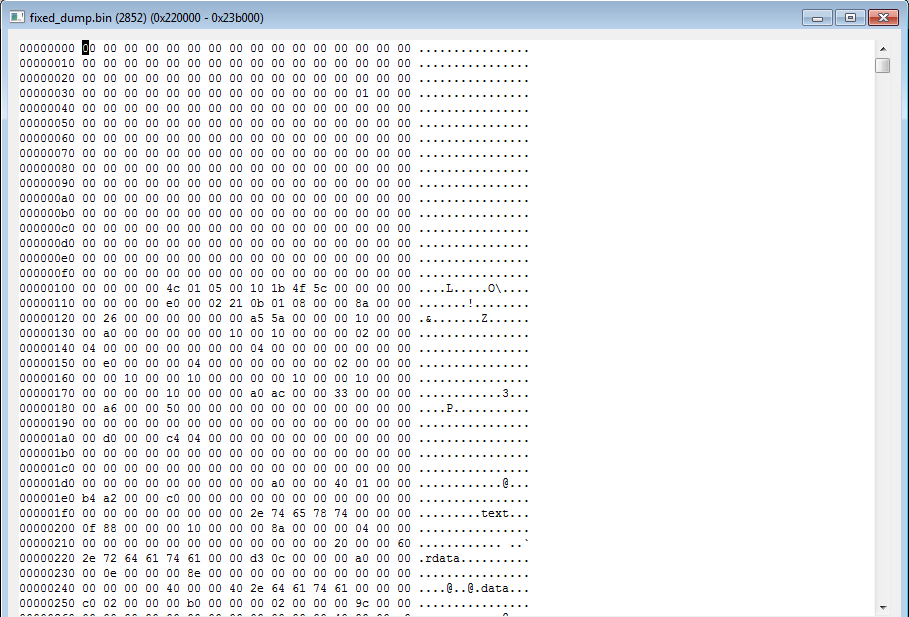
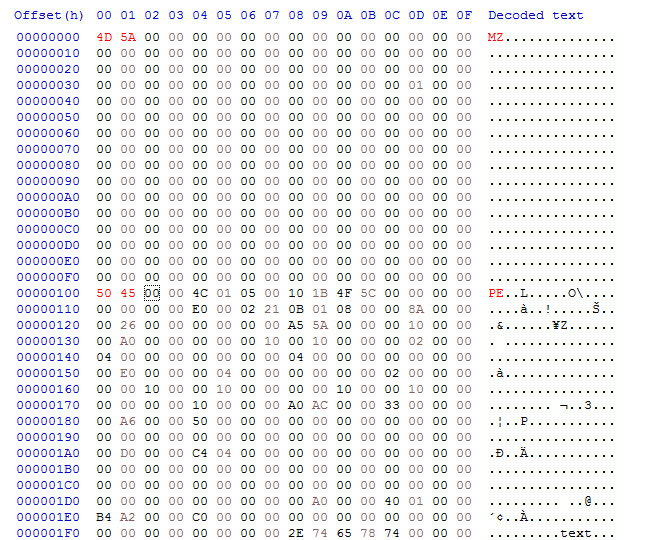
Backing out from the decompression function, the program makes sure that the size of the decompressed executable is the same size as the value stored in the JJ structure. If the sizes do not match, the decompressed executable is cleared from memory, using HeapFree(). Then, the malware XORs the first DWORD of the decompressed data with the XOR key stored in the structure. Taking a look at the decompressed data, we can see that the first DWORD of the executable is not valid – it should look like 00009000, but instead looks like 54205BD4. After the XOR, the valid value can be seen. The function cleans up after itself, and then returns back to the calling function. If you were to dump the executable at this stage and add “MZ” to the start, you would be unable to open it in PE Bear – this is due to the fact that not only is “MZ” missing, “PE” is also missing from the header, so make sure you add that as well.
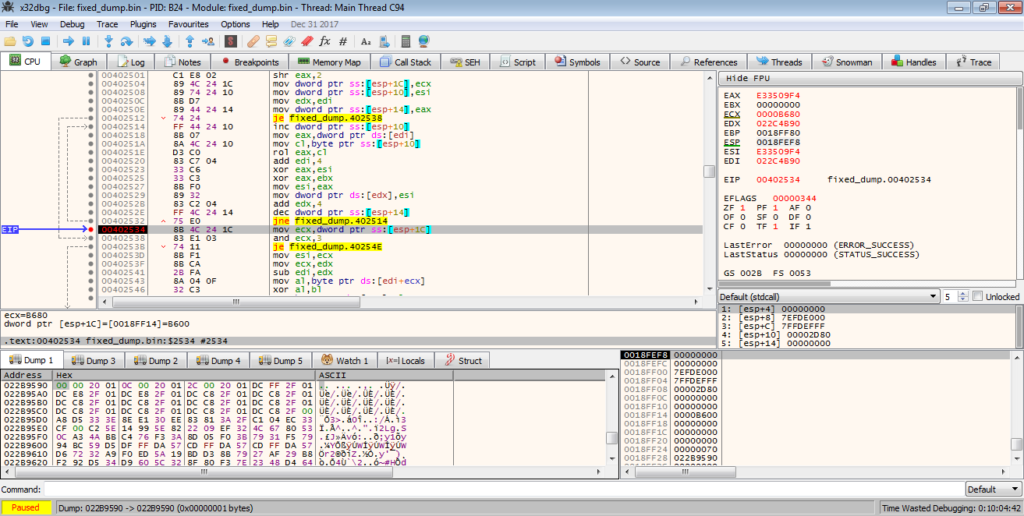
Back in the calling function, the malware then overwrites the decompressed executable using a rolling XOR algorithm. I’m not exactly sure why it does this, as the executable is later decrypted, so if someone could let me know that would be great! Anyway, once the executable has been encrypted, the function carries on.
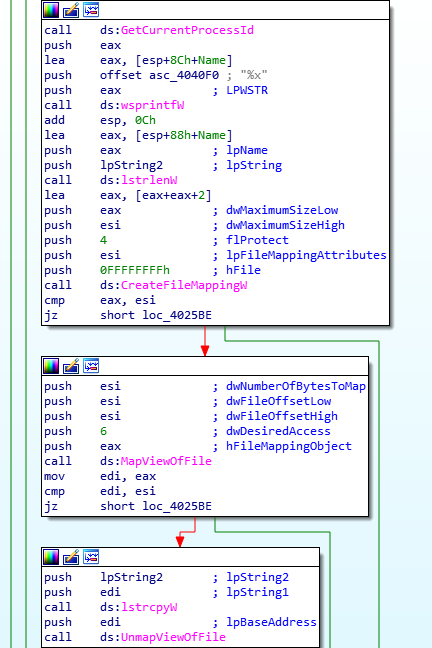
First, it creates a new file mapping, and calls MapViewOfFile, and then copies it’s filename to the newly mapped region, before calling UnmapViewOfFile. Again, I’m not too sure why this is being called, as it doesn’t seem to do anything, but if someone could drop an answer to this that would be great, and I can incorporate it into the post.
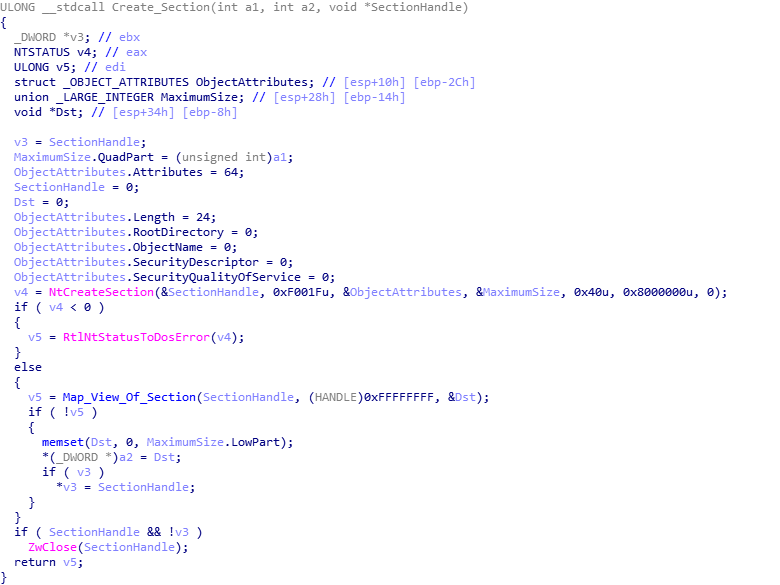
Moving on, the final function in this sample is called. This is quite a large function, so I will attempt to summarize the main points. Firstly, the function begins by moving different pointers around, and then compares the first 2 bytes of the encrypted executable to the value 0x5A4D (MZ) to check if the data is encrypted or not. As it is encrypted, the result will not be 0, and so it will allocate a heap based on the size seen in the embedded JJ structure. Next, it will call another function responsible for performing another rolling XOR algorithm, that will decrypt the data. This is a bit different to the last one, but should return the same executable that was decompressed earlier. Then, it will locate the value in the PE header that indicates the architecture of the executable, which in this case is 0x14C, meaning it is x86 based.
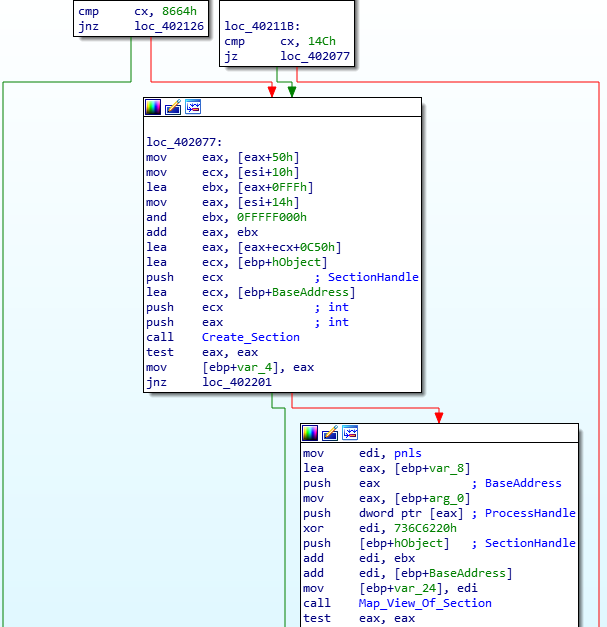
Next, the malware will allocate a brand new section of memory using NtCreateSection(), which will be set to Read-Write-eXecute. Eventually, this will contain the decompressed executable.
From there, an address located inside the newly created section of memory will be formed, pointing to 0x0022EC50, which will be used later. The created section of memory is replicated, to the address 0x00240000. Next, the program begins to copy over the executable to the new addresses, however it skips the entire MZ header and simply copies everything from the PE header.
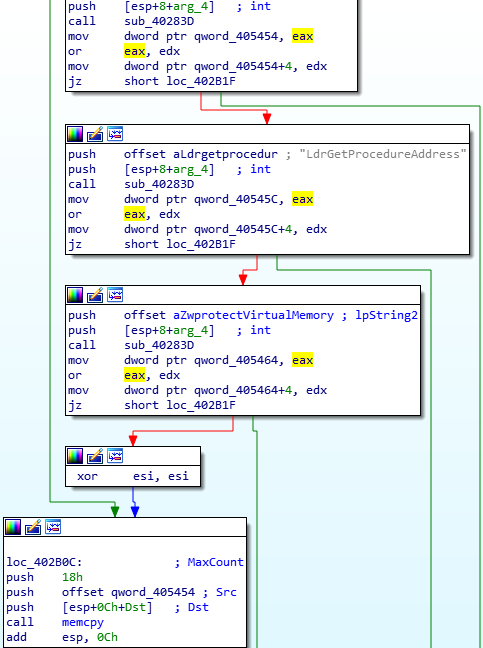
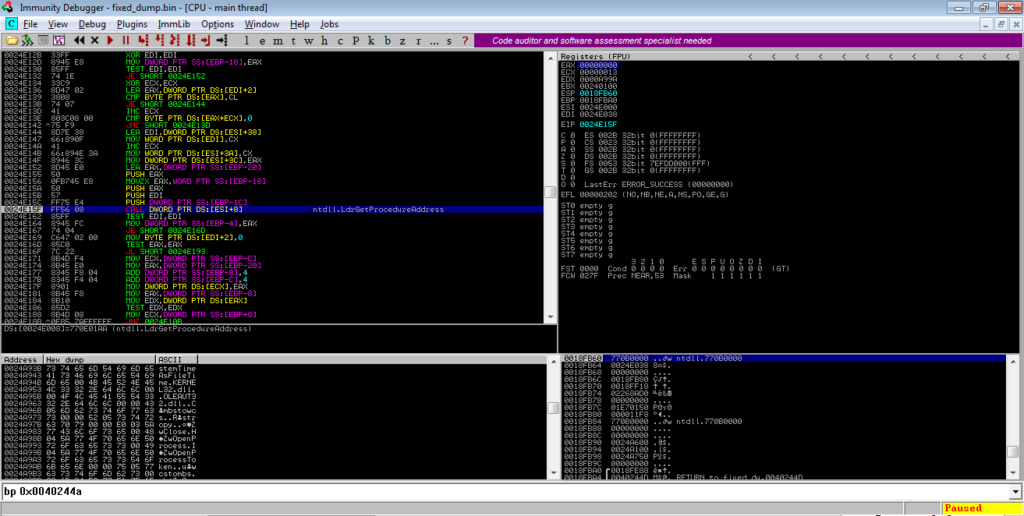
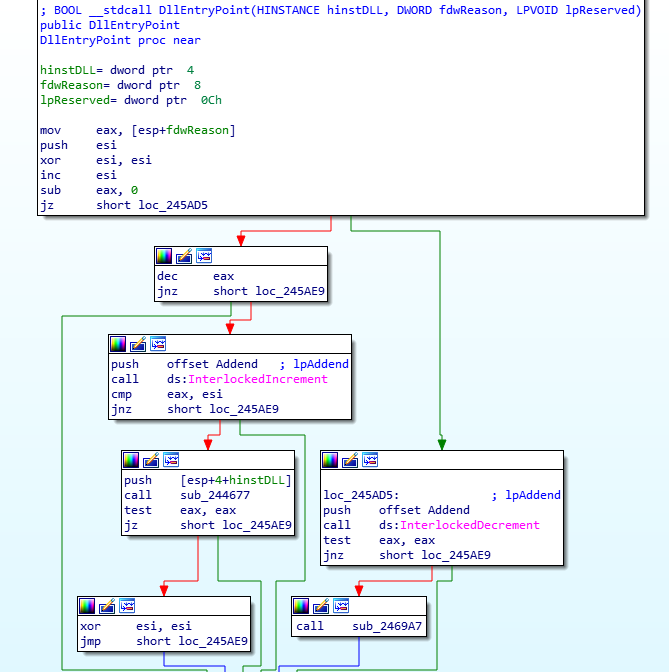
Then, a function is called that imports some more API calls from NTDLL, however this time it is not done using CRC hashes, and the name is simply passed as an argument. The imported API calls are; LdrLoadDll, LdrGetProcedureAddress, and ZwProtectVirtualMemory. The pointers to the addresses are stored in the same region of memory, split by 4 null bytes each. These addresses are then copied over to the executable at 0x00220000 for usage during it’s execution. Next, a region of code is copied over to the executable in memory, just 40 bytes after the loaded APIs. This is what will be called before the next stage is completely executed.
Continuing on, the next function is responsible for passing execution over to the executable. There are 2 functions that pass over execution to the executable, however they depend on the architecture. In this case, I will be looking at the x64 version. It is quite simple, as all it does is call the function at the address 0x0022E040, which will prepare the next stage. Therefore, you can think of this stage as another “unpacker”, as all it does is unpacks the executable, however there are many functions that carry over to the next stage, making it much easier to analyse.
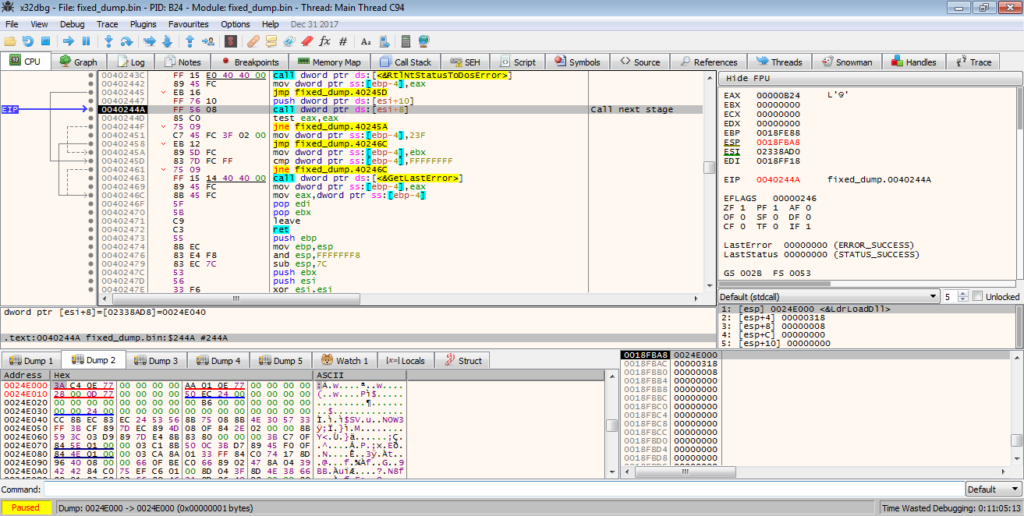
When we step into the function, there is an int3 waiting for us, which acts as a breakpoint that raises an exception, stopping us from stepping over it. To fix this, we can put a breakpoint on the previous call, restart the debugger and then run it until the breakpoint is hit. This should hopefully remove the int3.
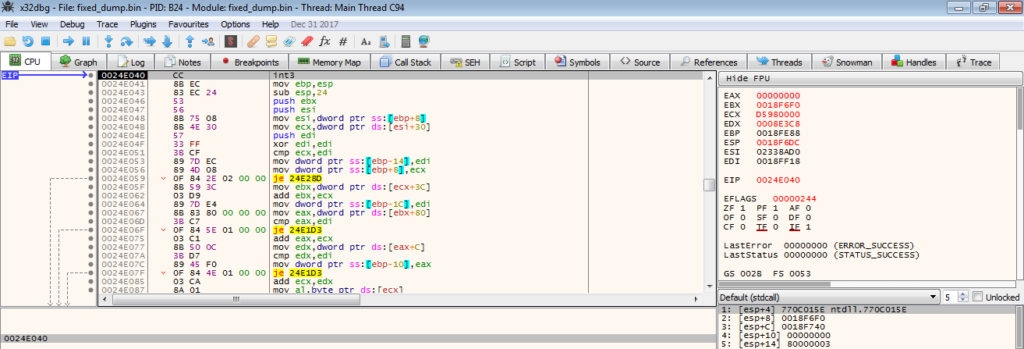
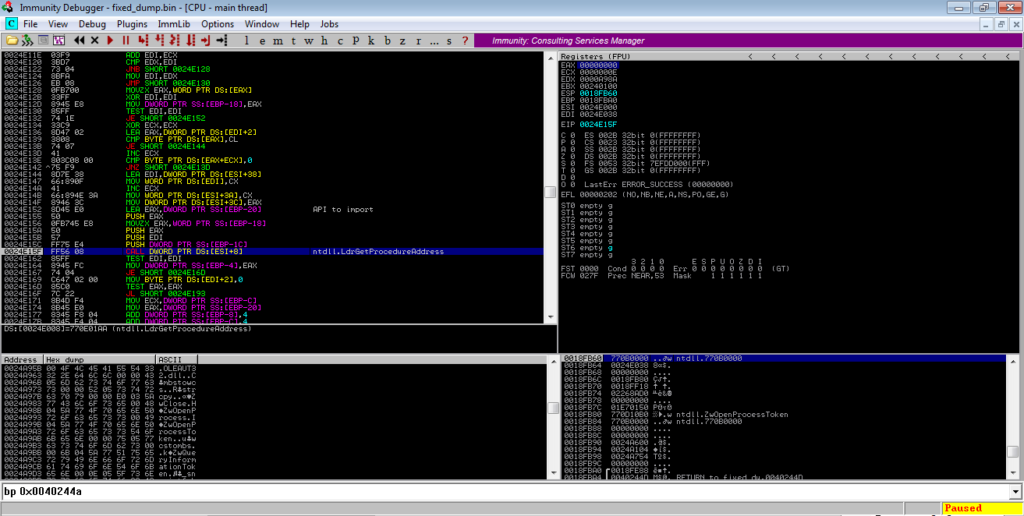
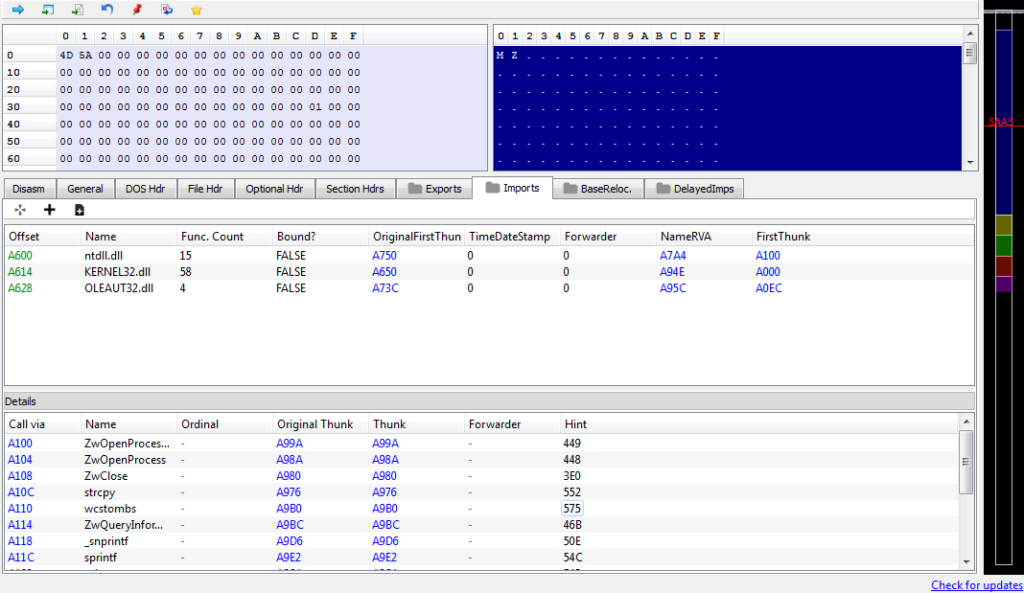
As it didn’t remove it in my case, I will use Immunity Debugger to carry on this section. The code is responsible for importing DLLs using the previously imported API’s – First, there is a loop which stores a DLL name in memory that will be loaded using LdrLoadDll. Then, a list of hardcoded APIs are looped over, with each being passed to LdrGetProcedureAddress. The DLLs that are loaded are; NTDLL.DLL, KERNEL32.DLL, AND OLEAUT32.DLL.
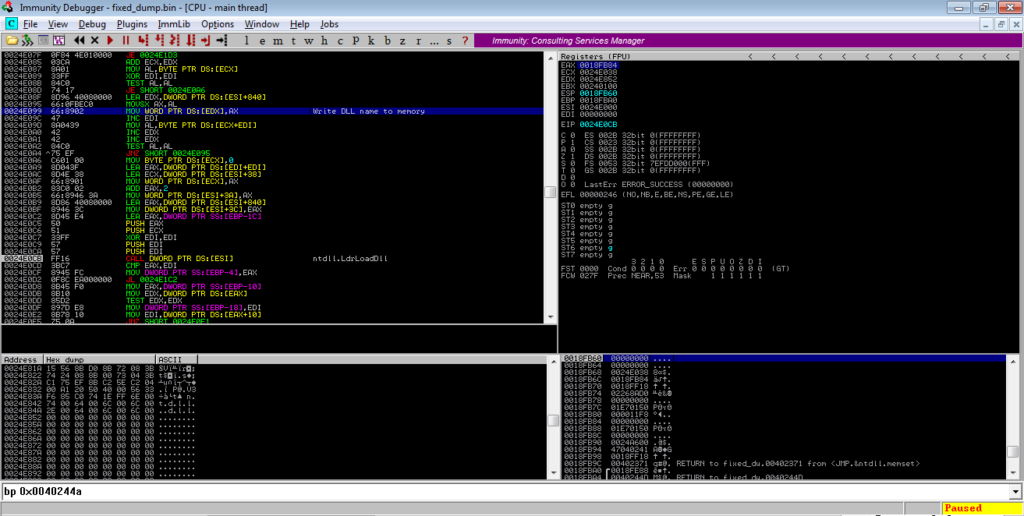
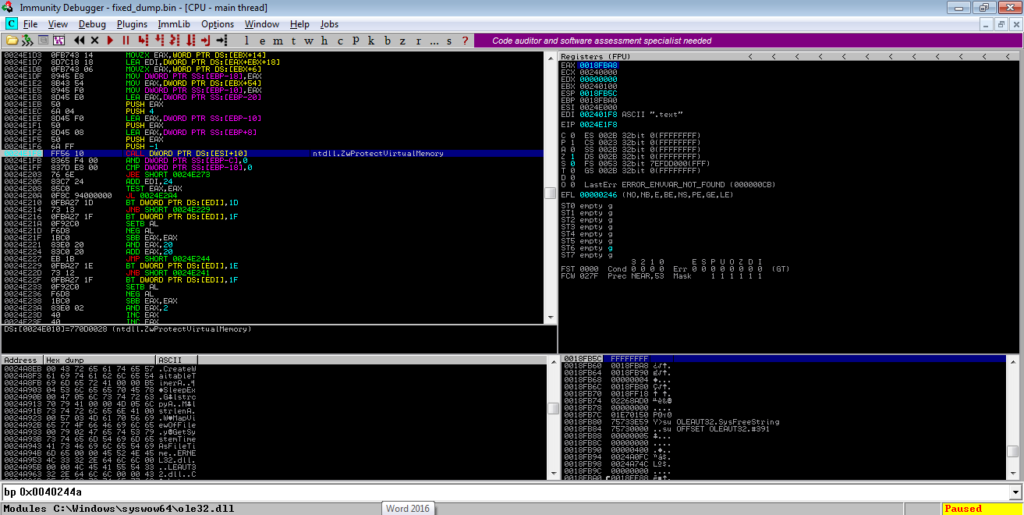
Once the APIs have been imported, ZwProtectVirtualMemory is called several times in a loop to alter the protections on several regions of memory.
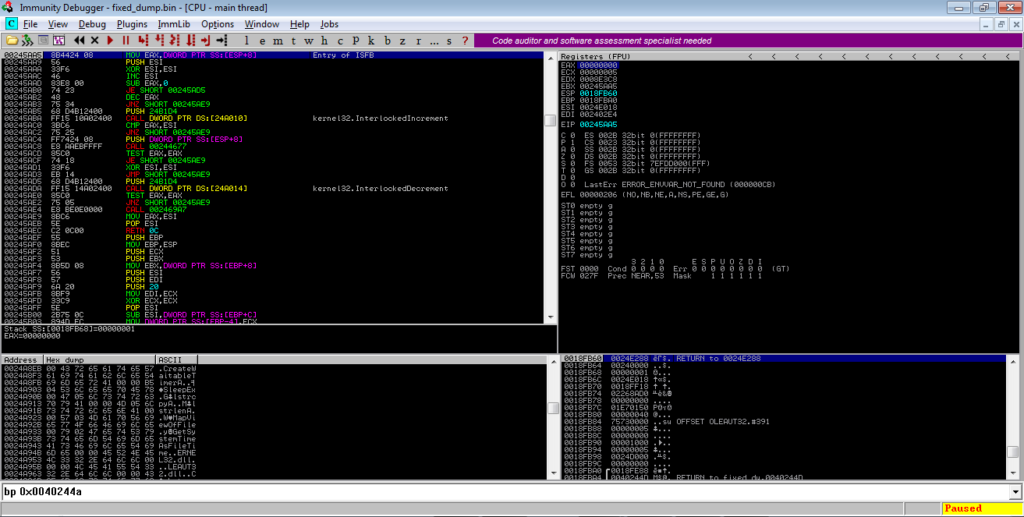
In order to jump to where the execution of the payload happens, we want to put a breakpoint on a call to a register, which in this instance is EBX. Run to that, and then step into it, and you should find yourself in the next stage of ISFB!
All we need to do now is to dump it out, add “MZ” and “PE” to the header, unmap and rebase it using PE Bear, and then we can start analysing the next stage!
MD5 of Dumped DLL: 52b4480de6f4d4f32fba2b535941c284Congratulations! You have managed to analyse the loader and “unpack” the next stage, which I will be analysing in the next post (because this one has now amassed over 6,000 words which is much longer than I planned). So, feel free to ask any questions you have down below, or over Twitter (@0verfl0w_) and I will be glad to answer them! I apologize again for the lack of posts recently, I’ve been working on my course as well, so I’ve had a lot of stuff to do! Hopefully the next post on ISFB shouldn’t take too long to do, so make sure to sign up to my mailing list to stay updated whenever I post! Thanks again 🙂
Comments (2)
Comments are closed.
Analyzing ISFB - The Second Loader - 0ffset
25th May 2019[…] haven’t checked out my last post on ISFB where we analyzed the first loader, check that out here to get some context for this part. The second loader is part of the infection chain for a group of […]
Dissection of an Incident – Part 2 – Insinuator.net
30th October 2019[…] https://www.0ffset.net/reverse-engineering/malware-analysis/analysing-isfb-loader/ […]